As of today, 11-6-14 both gold and silver have triple time frame MACD bullish divergences on the weekly, daily, and hourly charts. So I am keeping a close eye on them for bullish reversals in the price action. Any daily reversal candlestick pattern could be used as entry. Or an hourly chart breakout/momentum signal could be used as well. In these types of cases, assuming a buy signal is given, the stop is placed below the low, and then a portion of the trade is exited by using the hourly chart to give stop movement and/or exit signals. Then a portion is held using the daily chart for signals. I have given ideas on how to trail stops using MACD or moving average channels in the past.
Also for the US stocks, the hourly chart bearish divergence is pretty mature right now, so we are probably very close to a short term pullback in stocks. However, given the strength of the rally and no divergence on the daily chart, it seems unlikely to me that a top of major significance could be made until at least a couple more weeks pass and some daily time frame momentum begins to show divergence.
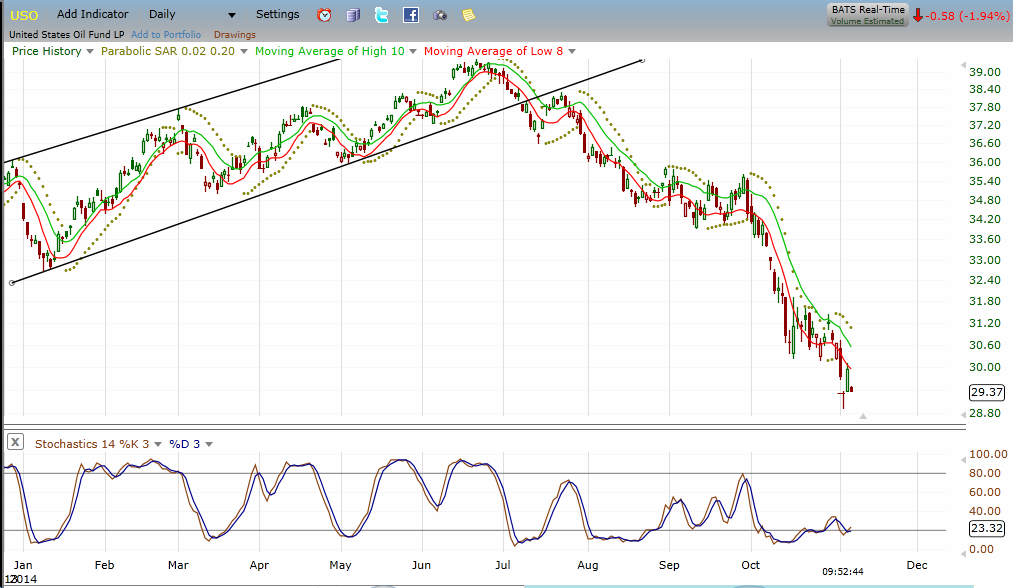
Also USO/oil prices are showing a very nice daily/weekly dual time frame stochastics set-up today for a long trade. Weekly stochastics is oversold. And the daily is oversold with bullish divergence and made a bullish reversal yesterday. A move above yesterday's high in USO would be a buy signal with a stop below the lowest point of this decline. A currently have an order in UCO to go long on a move above yesterday's high.
Click Chart to Enlarge
This is USO daily chart showing the stochastics below which has bullish divergence. Multiple commodity markets have the underlying technical and smart money sentiment to stage major rallies.
Thanq so much for sharing this Imformation .We are Providing Best free Trail services For Traders who r Trading in share market. for other more information visit our blogs.
ReplyDeleteMCX Tips,Free Tips