Click on Chart to Enlarge
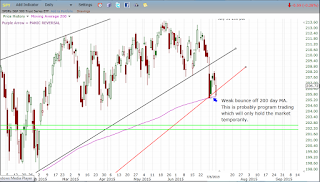
Last week the SPY etf rebounded off the 200 day simple MA. Now today it came back down and touched again. And buying came in after the open to hold the close above the average. Also note that the long term bull market trendline (in red) is right in the same area as the 200 day MA.
It has been a while since I discussed this phenomenon extensively so I will link to a post I made in 2011 which showed a very similar chart set-up. You can go back through your charts and see the resultant action.
Basically what happens at key moving averages in stocks or indexes - I believe - is that there are many trading algorithms that use those averages as data points for initiating trades. And so in this case you have price moving down, and it touches the average. But every time it touches, the program trading kicks in and starts to initiate buying. This is because the market is in an uptrend, and the weight of the automated trading is on the buy side.
And sometimes that buying is very strong and prices bottom right at the average. But other times, there is no real interest. It just chops around until the automated trading is spent, then the trend continues ( in this case down).
So one of the keys I have found is to look at the action after the moving average is touched. If you go back to Feb 1st 2015, you will see the type of action that unfolds with strong buying followed by a gap up, and a formation of a lasting low. So for a bullish reversal to hold, you will often see a close high in the range, followed by a gap up and a close above the open after the gap up. Volume often will rise on these days as well.
Contrast this with the moving average tests where the reversals off the averages are weak, and the result is often several touches of the average. This is what we are seeing here so far. The gap ups last week were on weak volume, and each day price closed below the open. Now we have a gap down (indicating still selling interest) and another test. For a successful test from here, we would see a gap up tomorrow and a close above the open, and higher volume.
Even if price makes a modest rally for a few days, a deep retracement back to the average would seem to me to be a sure sign of a failed rebound attempt off this average. The result would be a swift break below the 200 day MA. It may lead to a big sell off in this case.
The yearly low is not too far below price on the SP500. And given the we are past mid way in the year, a break of the yearly low, could trigger further selling in stocks.
My suggestion here is to short this market on a break of today's low with a stop above the rebound high from last week. If price make a weak rally back towards last week's gap down, I would suggest a short there.
Now if we see a gap up and close above the open tomorrow with dominant buying interest (increased volume, close in upper portion of range) I will certainly respect the rally attempt until last week's low is broken.
Pete

No comments:
Post a Comment