Click on Chart to Enlarge
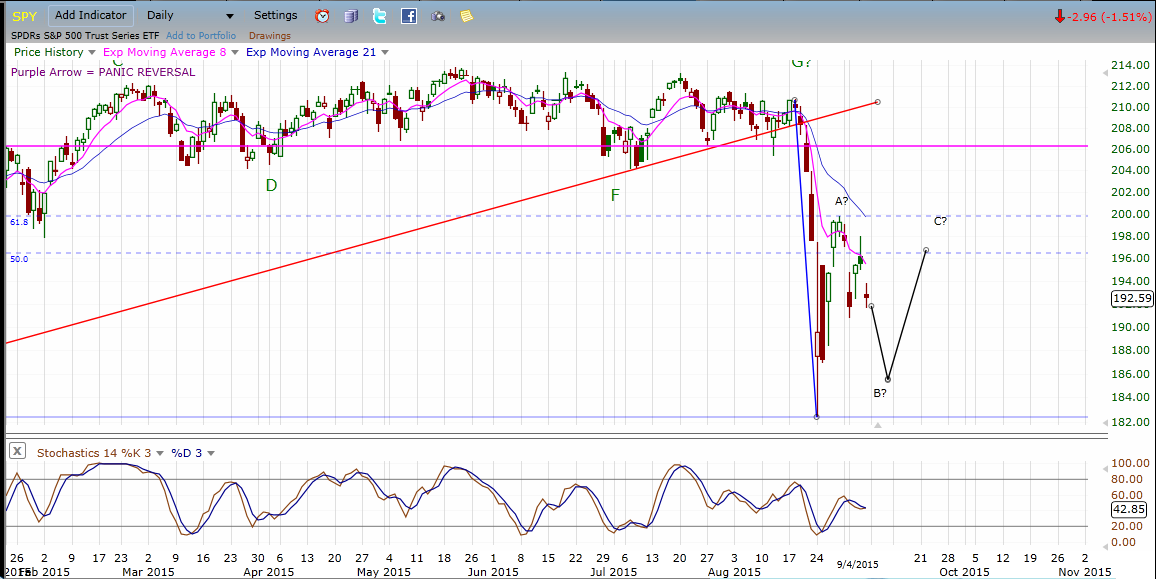
This chart shows the SPY etf daily chart with a proposed future path of price action based upon similar instances of price action in 2008 and 2011, as well as 2000.
The market has a way of making a whole bunch of price movement in a short period of time, and then just when everybody "knows" the trend, it chops around and creates trendless volatility, which functions in the market ecosystem to destroy the weak and leave only the strong.
The closest fit past instances to the recent market plunge consistently show a choppy retest of the "crash" low, followed by another reaction rally as the low is retested.
From the stats that I have looked at in the past few days, as well as the chart comparisons, I would project a further retracement towards the low, followed by another sharp buying rally.
Option expiration occurs Sept 18, and I think that could be a factor in seeing prices stay range bound until expiration. I think with the August expiration occurring on the 21st, and then the big gap down and plunge the following Monday, option buyers were likely to be active in days since the plunge. However, the in the options market, it is the sellers that are the long term winners. And in the mysterious ways in which the market behaves, I think that the sellers will win the battle until expiration. Basically the closer the price action expires to middle of the range since Aug 24, I think that would likely punish the near term option buyers.
So from my standpoint here, the next key trading opportunity will arise as price retests the recent low.
I think the 15 minute or 30 minute charts will have to be used to get any reasonable reward to risk ratio on the ETF side of trading.
I do feel that short term option plays will present themselves as we continue to move forward.
Pete
No comments:
Post a Comment