Showing posts with label put options. Show all posts

Tuesday, June 7, 2016

Put Option Trade on SPY 6-8-16

Today was a potentially important day in stocks given the backtests which I ran today after the close of the market.
Here is a relatively simple scan:

  • VIX/VXV less than 0.86
  • VIX up more than 2%
  • SPY up more than 0.1%
Now the VXV has a limited history going back about 8 years.  So we only have instances from the current bull market to judge.  However, I ran the same basic idea and removed the VIX/VXV filter and instead ran added a filter of the 5/63 day total put/call ratio being less than 0.92.  And the same approximate results occurred even with different days showing up.

Click on the Chart to Enlarge

This chart shows the summary of future returns for the next 6 months.  We can see there are not many instances, but basically stocks had run out of steam and were set for a significant pull back over the coming weeks, beginning soon.  The skew is very negative over the coming couple months.

As for the options there are profitable plays in several different strikes and time frames I am sure.

But I think the most sensible is the following purchase of an option.
Click on Chart to Enlarge

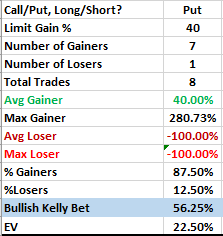
This chart summarizes the past results of buying an at the money put option with 2 weeks until expiration and setting a limit order to exit at a gain of 40% or letting the option expire worthless.
7 out of the past 8 instances hit the limit order making for a very nice opportunity.

In the current circumstance the closing value of SPY was more negative at 8 days forward compared to 10 days forward, so it indicates that the maximum gain was likely to occur within 8 days from entry of the option.  So the option to purchase would be the standard June 17th expiration option.  In this case I would go with the 212 strike put on SPY.

The key to long term success once a profitable method is obtained is to have as close to optimal money management as possible and to always stay "in the game".  So my point here is that the above profile suggests an aggressive position is very justifiable.  But if you use a simple % of account allocation on all trades, then there are many profitable orders.  Buying 2 months until expiration and setting a 70% or 130% limit gain and letting losers expire worthless will also both provide profitable plays based on past stats, and allow for this month's expiration to pass if there is anything holding the market up through expiration.  

So it may make sense to take the full position and split it into 2 parts, with half in the 2 week until expiration and half with a 2 month expiration 212 SPY put.  

On the equity side, entering short SPY here and then setting a paired limit order and stop loss order of 6.75% or exiting after 2 months was a simple a nicely profitable trade.  The expected value on SPY was about 3.5%.  Stats allowed leverage of 3x on the whole account if using a triple leveraged bear ETF.  So the return expected on the account would be about 10% expected over the next 2 months by using the 3x inverse ETF.  This would be a more conservative play, but one that could be used in all types of accounts and provide a standout return during an expected downtime in the markets.

I know this post has a lot to sort through, so comment or reply if you have questions regarding the info or your situation.


Pete

Wednesday, March 9, 2016

SPY Put/Short/Inverse Trade Stats Suggest an Outstanding Opportunity Here 3-9-16

Click on Stats to Enlarge

In follow up to the earlier post today, here are the stats for buying an at the money SPY put on signals corresponding to Monday's close.  So a limit purchase of Monday's close in the April 15th expiration SPY 199 strike put would have a greater than 80% probability of reaching a profit of 80% or greater prior to expiration based upon the data going back to 1995.  There are only 28 instances.  The Kelly Bet is super high at ~67%.  Since these types of scans will never include all possible data and all history, then I always suggest reducing the actual risk from the Kelly bet amount.  One must consider draw down as well and adjust accordingly.

Click on Stats to Enlarge

The stats here show the outcome of shorting SPY at similar signals and then setting a stop loss of 4.5% and a limit gain of 4.5%.   If the limit orders aren't hit then the trade is exited in 1 month (21 trading days).  Notice again a very high win rate and a corresponding high Kelly Bet %.  In actuality, the MAX expected value would be to set an even wider limit gain and loss.  But from the results, I think this limit order makes sense for those who are using some type of leverage and don't want massive stop loss differentials from the entry price.

So the trade here would be to short SPY at ~200.00 and then set a stop at 209.00 and a limit exit at 191.00.  But exit at the close on April 8th if the orders are not filled.

Even just entering short at the current price and setting +/- 4.5% orders from here, should result in a similar risk and reward profile.  Manage the trade in the same fashion as stated above. 

The historical stats justify using maximum leverage in an equity account by 3x inverse ETFs or simply full margin (2x).

Comment here if there is any further assistance desired in managing trades regarding this information.


Pete

Wednesday, October 7, 2015

Complacency In a Downtrend Is a Short Set-Up - SPY Analysis 10-7-15

Click on Chart to Enlarge

As of this morning's high in SPY, there is a marked 30 min MACD bearish divergence.  The daily %K stochastics is nearly to the 80 mark indicating an early stage "overbought" signal.

In the chart above I have marked with arrows the times since the Aug 24th low where there was a 30 MACD divergence, and all have been good buy and sell points in the range.

It is possible that a 5 wave type move is completing off last week's low.  And this may be the "c" wave of a flat type pattern up from the Aug 24th low.  Additionally as noted by the red line on the chart, the gap down from the day after the recent FOMC announcement has now been filled, and from a charting standpoint, the fill of a significant gap, with reversal can be a continuation point of the dominant trend (in this case down, as indicated by longer term moving averages).

I ran a scan today which looked at time when the overall market real money sentiment as evidenced by the "complacency" indicator I have developed, is below a certain point in a down trend.

The scan criteria were:
  • 252 day EMA is down
  • Weekly MACD is in sell configuration (MACD
  • Complacency was less than 29.0 (this is pretty low for a downtrend)
  • Looking back only to the 2007 market top (volume is a factor in the indicator, and previous market environments had non comparable average volume)


What we see on this scan is a massively profitable result in the option looking out 2 weeks.  The expected value including losers is ~65% on the ATM put options with 10 days till expiration based upon past similar occurences.  So this type of set-up has preceded some major pullbacks over the coming weeks.  Notably some occurences were right near the highs of counter trend rallies in the last bear market.  The limit order to exit the option in this example is 210% which suggests a big move down.  Based upon this I would suggest the Oct 16th standard SPY put option, 198 strike.  Then use the limit order of 210% as suggested here based on the data.  

A partial profit could be taken at 120% based upon the data if you want a tiered exit.


Pete


Tuesday, September 15, 2015

Time For a Grand Slam Swing - SPY Puts 9-15-15

I ran a scan today based upon current market action and found data suggesting an opportunity for a profitable play in index puts.  Data only goes back 20 years (to Sept 1995).

I may provide more detail later, but the scan had the following criteria:


  • 63 daily EMA is pointed down
  • 63 daily EMA is below the 252 daily EMA
  • 14,3,3 daily %K stochastics is greater than 75
  • Daily MACD line is above the signal line
  • Today's gap up is greater than 0.25%
Buying an ATM put option with 2 months until expiration and holding until expiration resulting in an average expected value of 59% gain including losers.

So a simple play here is to buy a November put option and hold until expiration.  If a high quality bottom reversal signal comes prior to expiration, the trade could be exited as well.  Such a signal will not likely come from my algorithms unless the August low is broken.

So the simple set-up here is that stocks could fall hard and cause a big move in the puts.  But a loss would be expected to lose the whole option premium.  So the Kelly Bet fraction was only in the 20-22% range.  Out of 28 instances, there were 11 instances which ended up in a profit position.

Click to Enlarge


Pete

Monday, July 20, 2015

Low Panic Levels Suggest Negative Skew Over Next 2 Months

Click on Charts to Enlarge

As of today's close, my complacency indicator shows a reading below 7.0.  The images above show all times in this bull market with readings below 7.0.  Of note is a consistent greater max loss than max gain on all time frames out to 5 months.  The greatest skew to the downside is at 2 months where it is about 1.6:1 in favor of downside.

Looking at the options gains for calls and puts for ATM options with 2 months until expiration, there are about 55 days which meet the criteria and the average max put option gain is about 150%. 

About 8 out of 10 of the instances showed max put gains of greater than 50%.

About 6 out of 10 of the instances showed max put gains greater than 100%.

So those stats suggest a couple obvious trading or hedging strategies by simply buying the put now, and setting the limit exit order.  Of course fine tuning could be attempted as action unfolds.

Now the 14 period Money Flow Index is also currently greater than 70.  When adding that criteria to the filtering process the 2 month max loss and gain show greater than 2.0:1 skew in favor of max loss.  And half the instances showed put gains of greater than 150%.

So I think an ideal situation here would be for some further upside leading to a divergence in the MFI and then to speculate on the puts. 

But for now, a 2 month hedge with ATM puts and a 50% limit order to exit the position seem like a solid odds play to protect for some potential downside into September.


Let me know if there are further details desired in regards to this data.


Pete

Friday, April 10, 2015

VIX Suggesting a Short Term Top Is Forming Here

Click on Chart of VIX to Enlarge

This chart is VIX hourly with standard bollinger bands as well as a longer term deviation band.  When the VIX approaches or touches the lower long term band and the bottom standard bollinger band moves below the bottom longer term band, the market is often near a short term high.  It shows that the volatility or "fear" in the market is relatively low and may be due for a price decline in stocks.

That is basically right where we are at right now in conjunction with a nice bearish trade set-up which was posted yesterday.  I have purchased SPY May 210 put options for 3.00 today.  There is not a lot of room to the upside before the trade set-up shown yesterday is failed.  And price has come into the resistance zone with further divergences today, suggesting that a short term top still may be forming today.

I am still holding the XLF puts purchased a few weeks ago.  I am awaiting a buy signal or panic extreme in my trading system in order to exit the near expiration puts (April and May).

If entering the SPY puts above my suggestion at this point is to place a limit order to sell the puts at 9.00.  That would put SPY back near the recent low end of the trading range and fill the gap up from 2/3/15.


Pete

Monday, March 9, 2015

XLF Put Option Purchase

As per this weekend's video update where I discussed the non-confirmation in XLF in conjunction with the current (so far) failed breakout in February, I have purchased contracts of XLF put options.

I got both May 25 strike and Sept 24 strike contracts for the position.

I will update on this again in the future as action unfolds.

I have no planned stop loss on the contracts.  Risking only what can be lost if they expire worthless.


Pete

Tuesday, January 6, 2015

Stock Market and Index Option Update

If you are holding or purchased any put options on the US stock indexes at my recent post about the sell warning, then the corresponding options I noted or something similar would be up over 100% currently.

At this time, the question may be whether to hold any portion of the position.

There is currently no bullish divergence pattern on the hourly MACD of SPY, and neither is there a bullish pattern as of yet on my personal trading algorithms which I use to identify bottom reversals in the markets.

So at this time it may be sensible to continue to hold part or all of a put option on the indexes.

If there are any questions or scenarios regarding this then comment or email reply and I will try to assist you.

Pete

Monday, July 7, 2014

MS Sept 33 Puts

I bought Sept 33 put options for 1.57 this morning on Morgan Stanley, symbol MS.

The set-up here is a dual time frame overbought at a slightly lower high compared to the last weekly over bought stochastics peak.  Daily time frame is showing strong bearish divergence and a shooting star reversal candlestick.

Also the VIX is showing a cluster of low readings with a couple closes below the lower bollinger band.  Based on my analysis of real money market sentiment and price, I view this current phase of the market to be a continuing bearish divergence that is probably very mature and likely to turn into a significant price decline for the time frame of this trade, even if for only 1-2 weeks.