Showing posts with label total put/call ratio. Show all posts

Tuesday, March 27, 2018

Short Covering Rally - Short Term Expectations 3-27-18

Click on Stats to Enlarge

Yesterday the stock averages gapped up and gained ground from the open in explosive fashion. 

After a period of decline, the question is what this means going forward.

I scanned the history of SPY and looked at times where the prior day closed below the lower Bollinger Band and was down 1% or more, and the current day gapped up 1% or more and made further open to close gains all without making a lower low compared to the previous session.

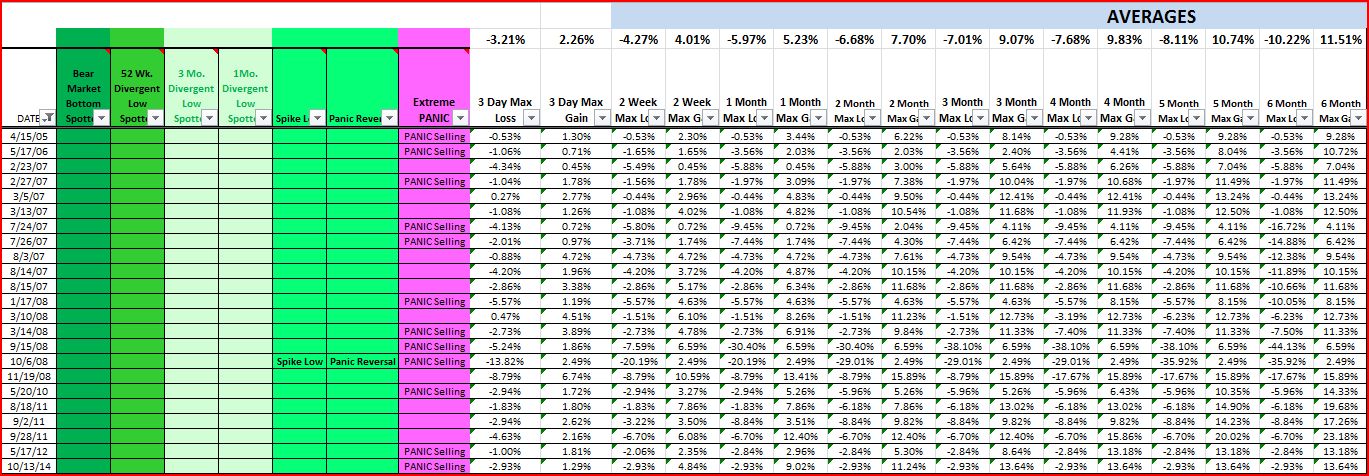
The above table is the whittled down history of market days similar to Monday going back to 1995 in SPY.

Of note, within the next 5 trading days, 6 out of 8 experienced losses of 3.7% or more relative to the close of the signal day (Monday in our case).

7 out of 8 experienced losses of 1.9% or more relative to the signal day close.

Those numbers are based on intraday figures, NOT on closing figures.  But we can see a clear skew to the downside right away in the past instances.  And on a closing basis, the first day following the signal days did not make much further gain or loss on average.  But the next 2-3 days following that showed about half the instances made some sharp breaks lower to retest the lows.

In going through the charts of the past instances, they all experienced some temporary support after a retest of the lows.  So we may expect that if prices do come back down to challenge Friday's low, that we could see further rally attempt somewhere between there or the February price lows.

Also, note that all the instances in that table were in the context of incomplete bear markets except the August 2015 instance.  So possibly this is a harbinger of a longer term shift???

Click on Stats to Enlarge

Also an extreme total put/call ratio was registered on Friday at 1.53.  The above table shows readings of 1.5 or greater in the past.

Also note the downside skew over the next few days.  Again, while not shown here, the MAX closing loss point is the 2nd and 3rd day after the signal. 

So both of these studies suggest a possible/probable retest of last week's low by Thursday this week or maybe a bit beyond.

That fits well with what I am seeing in time cycle analysis in the Nasdaq, which currently projects a bottom on March 29th which is Thursday.


I will update as action unfolds over the next couple days.  Personally I would be looking only to play clear short term reactions expected to the upside of say 1-2 weeks, with the idea that the longer term trend may have shifted to down already.


Pete

Monday, February 12, 2018

Expect Another Round of Selling After A Possible 1-2 Week Rally from the Recent Lows - 2-12-18

In follow up to a post from last month on put/call ratios which was timely and gave forewarning of the potential for a sizeable sell off to come over the next few months, I want to reflect on the development of those comparable instances to gauge how the decline may unfold and see what type of readings (in the indicators which flagged the decline) showed up at the end of the correction/leg down.

I had looked for times when:

  • 21 day avg. of EQUITY put/call was less than or equal to 0.92 of the 84 day average
  • 5 day avg. of TOTAL put/call ratio was less than or equal to -0.95 standard deviations below to the 20 day average

As the ensuing sell offs developed, there was tendency for a 1-2 week rebound rally to occur when the 5 day avg. total put/call ratio rose above 1 st. dev above the 20 day average.  At the first occurence of this, the above mentioned equity p/c ratio had moved back up about ~1.0.

However, that rally offered a secondary selling opportunity.

When the corrections had bottomed in the other instances, the 21/84 equity p/c ratio had flip flopped to a reading of 1.08 or more, indicating a comparable imbalance in the opposite direction.  When those levels had been reached in the longer term eq. p/c ratio, then a total p/c reading indicating extreme pessimism was a great indication of a more lasting rebound attempt.


So our current market seems to be following this template so far.  The initial plunge over the last 2 weeks, has led to a short term spike in p/c ratios.  But the 21/84 equity p/c ratio has only just reached back to 1.0.  

The current small rally may be expected to continue for several days.  But the past instances would suggest the probability that another move down will occur with a higher 21/84 ratio.  And that could very well make a significantly lower low.  A shorter term pessimistic extreme in the ratios which occurs in that context would fit the template for a larger rally attempt.


Pete

Monday, December 4, 2017

Short-Term Weakness Ahead Suggested by Total Put/Call Ratio 12-4-17

To follow up on my recent post regarding SPY and the forward outlook here, I have 2 back tests of current conditions that I think are worth mentioned.

For the short term, today gapped up and price is opening outside the upper bollinger band and at a new 52 week high.  I ran a back test of similar conditions and looked at various sized gaps. 

The result is that there is about a 4 or 5 to 1 greater MAX loss than MAX gain during the session/today, based upon the back tests.  The average intraday decline FROM THE OPEN, has been about 1.0%.  And the close has been below the open more often than not, with a open to close loss of ~0.5% in the back tests.

So for the short term, this was/is a sell at the open and cover at the close situation, with a 60-80% chance of a gap fill during the session based on the back tests.

Click on Table to Enlarge

What this shows is a scan of times when the 5 day total put/call average was less than -1 standard deviation below the 20 day average of the total put/call ratio AND prices were at a 52 week high.  I also removed clusters so that we were looking at unique instances.

And what we can see is that there was a very skewed downside over the next week.  In particular, at the 3 day mark, which would be through Wednesday this week, there was about 7:1 MAX loss versus MAX gain.

So this would suggest that we are likely to see prices reach resistance here and have a modest sell off in the short term of the next week or so.


Each market environment is unique, and with prices turning parabolic to the upside for the last week, it sure doesn't FEEL like the downside risk is notably larger, but the combo of new price high with extreme complacency from the put/call measure has suggested that short term weakness is probable.

Monday, July 31, 2017

Total Put/Call Ratio Sell Warning Suggests Negative Returns Ahead

For longer term followers of the blog, you may recall my repeated notes on times when the total put/call ratio drop relative to its intermediate range.  The following chart shows the way I have tracked it for years.

Click on Chart to Enlarge

The 5 day average of the total put/call recently dropped to its lower 1 standard deviation band.  This indicates relative complacency compared to the recent range.

Now there is a seasonal tendency to lower put/call reading in December, though they still may be significant.  But today I looked at past instances where the reading came in the doldrums of the year - in this case either July or August.

It is well known that there is a seasonal tendency for increased volatility in the Sept/October time frame, and that many major sell offs historically have often been in Sept and October.  So I wondered if the current signal would reflect a tendency for subsequent market sell offs.

So I looked back through my data going back to 1995 and looked at all similar set-ups on the total put/call in July or August.  I removed any clustered signals after the first in a series so that all readings are "unique".

The short of it is that past signal did indeed lead to average poor performance and negative skews to forward price changes in SPY.

From the 1 month to 5 month forward looking time frames the average MAX loss was greater than 3 times the average MAX gain.

My options trading model shows the following data, suggesting a 200% limit order on an ATM put with 2 months until expiration would be a great option strategy.  And even better according to the past instances (only 9 instances), would be to buy an ATM put option with 2 weeks until expiration and hold until expiration.  In this case that would be basically August standard expiration.  Personally I would rather buy time into September because that is historically the most negative month for stocks.

Click on Table to Enlarge


Some additional data on the equity/ETF side of things.......
At the 1 month forward mark, 7 out of the 9 instances had maximum declines of 2.6% or more.

And at the 4 months forward mark, 8 out of 9 instances had maximum declines of 3% or more.

And using my trading strategy of an OCO limit sell order and stop loss order on an inverse ETF, the MAX return scenario would be to set an 11.25% limit gain per the SPY etf and an 11.25% stop loss.  Then exit at 4 months if neither order is filled.  That would be approximately November 24th.

Now the stats on the past instances justify using leverage of 3x or more on this move, in which case you would take the percentage numbers above for SPY, and then triple them for orders if using an ETF like SPXU to try to capture the anticipated move.


Let me know if there are questions or clarification needed here.  Volatility makes its seasonal lows around this time of year, so understand that it pays to position yourself for the times of year when the odds of a significant move are higher.  It may take a little time to unfold, but feel the indications are clear that downside risk is higher than upside potential here.


Pete


Thursday, February 9, 2017

Put/Call Ratio Analysis Helps to Identify Stock Price Tops and Bottoms

Click on Chart to Enlarge

The chart above is a slightly different version of one I have shown many times over the past several years.  This chart is a 7 day average of the total put/call ratio with some standard deviation bands around it.

The interpretation of the chart is pretty standard for technical analysis.  I like following this data because it is not looking at price.  It looks at a measure of underlying "sentiment" as evidenced by large scale options transactions.  So price is an effect of other underlying causes in the crowd.

I have made a mental construct over the years which likens the movement of market prices to physical movement.  Once a direction is set, there is an inertia, and other than UFOs, we typically see a process of slowing or momentum changing prior to a shift in direction of the object.

That "slowing" before a change of direction is evidenced by divergences.  So we have a situation where the direction of the market in this case is still "up", but the put call ratio is showing a marked divergence indicating that the underlying sentiment or driver of prices higher is actually slowing down.

As noted on the chart with red and green lines, the general idea here is to look for an extreme data reading, outside the bollinger bands indicating that the trend may not be sustained at that rate.  These extreme points are typically NOT final highs or lows.  The actual end of a move, will most often occur after a divergence develops, with new price extremes, but often markedly non-confirming put/call ratio readings.  And the reading at the end of the move are usually well within the deviation bands, and so do not appear significant on their own.

My point here is to give a little perspective but to make note of the classic divergence pattern here in the sentiment which has put me on alert that we are near the end of this rally since November.  And we are likely to see at least a minor correction occur of the uptrend.  It has been ~2 months since the extreme reading in the put/call ratio occurred.  And my observation of this types of divergences is that a trend often persists for several weeks after the extreme before a final price high or low.  If I had to make a guestimate of the average, it would be about 6 weeks.  So here we are at about 8 weeks since the extreme, and I believe that markets are likely to peak any day now.


Pete

Tuesday, April 19, 2016

Intermediate Term High Likely Completing In SPY 4-19-16

I ran a pretty simple scan today on the history of SPY (going back to fall 1995).  The criteria were as follows:

  • VIX high is less than 15
  • 5/63 day total put/call ratio less than 0.85
  • Daily MACD is in bearish divergence position
The forward returns showed a nearly 2.4 times greater MAX loss versus MAX gain over the coming month.  And buying a 1 month until expiration at the money put option on SPY had a 2 out of 3 chance of at least doubling in price prior to expiration.  So that is a very profitable speculative opportunity to buy the put here and simply set a limit order to exit at 100%.  Let it expire worthless if it loses.  There is no stop.

Also there is a dual time frame (hourly and daily) MACD divergence on today's highs in SPY.  These types of set-ups have been highlighted many times on this blog and often nearly pinpoint a significant turning point for multiday or multi week changes of direction.

So the point here is that SPY is at a lower high than the last intermediate term high in November, and SPY is displaying the type of set up which indicates a completed rally.  So the easy money has been made.  The expected returns for the next several weeks are likely to be flat or negative based on what I have looked at.  

Let me know if there are any questions or specific scenarios you want further info on here.


Pete

Monday, March 7, 2016

Brief Update on SPY and Trade Set-Ups 3-7-16

Over the weekend I ran some scans looking at historical reward and risk in SPY relative to some possible technical and sentiment backdrop data which may occur as this rally continues.

Currently the total put/call ratio is showing some complacency in the short term relative to the longer trend.  Coupled with overbought stochastics, and bearish long term moving average configuration, that stats I looked at suggested a good reward to risk opportunity would be in place for a short position or inverse ETF position in SPY.  In this case, the best reward to risk ratios seemed to occur with a 2-3 month holding period.

So this is something I am watching and will update here.  I think it would be ideal for stocks to rally further towards the 200 day moving average at which point program trades may kick in and provide some volatility to take advantage of.

Click on Chart to Enlarge

The chart here shows the total put/call ratio in a configuration I have showed many times.  The 5 day average is low relative to the bollinger bands which typically shows a market which is ready to pull back, though not necessarily immediately.

Click on the Chart to Enlarge

Also the 5 day average is low relative to the 63 day average.  And in the context of a longer term moving average downtrend in prices (50 ma< 200ma), this would seem to indicate a notable real money sentiment point which could mark the approximate top of a counter trend rally.   Again I will keep an eye on this and run some factual scans based on the data this week.


Pete

Thursday, July 9, 2015

Elevated Total Put/Call Ratio - Implications

Click on Chart to Enlarge

Yesterday the total put/call ratio spiked to 1.46 which is in the upper end of the historical range.  So looked at what this may mean for us moving forward.

The table above shows times when the total p/c ratio was above 1.4 going back to 1995.  It also then selects only those times when the close was not greater than 0.61 of its daily range.  So basically I am filtering out day where the ratio is very elevated but prices manage to stage a close in the upper portion of the range.  This weeds out a few significant bottom reversal days which the action was obviously different than yesterday's low close.

What we see is that there is a greater max loss than max gain on average over the next month.

In just under half of the instances, all the max loss over the next month occurred within the next 3 trading days.  So that suggests that we will see likely lower lows coming relatively soon after Thursday's rally attempt.  But then there may be a more sustained rally attempt from a lower low starting point.

Since Thursday (today's) trade is gapping up significantly, we can look at times when the next 3 days did not make significant lower lows.  On the table above there are 4 out of 23 times.  And in 3 of them, the 2 week max loss is still greater than the 3 day max loss.  That suggests that of the times when the rally was immediate, prices still faltered after a brief spurt higher.  This suggests that after a couple days rally attempt here, prices may be likely to make lower lows for the move within the next 2 weeks.  That seems to me to be an ideal set-up for a near term put option purchase.

So say price rallies to 208-210 on SPY by tomorrow/Friday.  These stats suggest that more likely than not, price will continue to make lower lows over the 2 weeks relative to Wednesday's close.  In fact, out of the 23 instances above, EVERY one made a lower low.  So the set-up would be that after a brief rally here, price will move back below 204 on SPY by the week ending July 24th.  So use that info to your advantage for short term put option trades if we see a little further push higher here the next day or two.


Pete

Monday, February 2, 2015

SPY at Support and Put/Call Ratio Elevated

Click on Chart to Enlarge

The chart above is the total put/call ratio with a moving average and some standard deviation bands.

I am showing this because based upon the recent history of the moving average, it is in the upper end of its range and is near the upper deviation band.  So there is the distinct possibility that the current price level or slightly lower will be a bottom region for stock prices.  However, note instances like early Oct 2014 when the ratio moved up and then came back inside the bands, only to be followed with a break to new low in prices which led to a significant price decline.

That scenario needs to be accounted for in the current environment as price has mostly traded in a range for the last two months.  So while price is at the lower end of the range ( and the put/call ratio is near the upper end of the range), price is not necessarily extended to the downside, and so a significant price break lower could occur.

Click on Chart to Enlarge

Here is SPY with bollinger bands.  The bands have not been narrow for the last 6 weeks, and 3 times since early January the SPY price has touched the lower band and reversed higher, including (so far) today.  My feeling here is that if today's low is revisited then it will probably occur with some significant short-term downside and multiple closes below recent support at 198ish.

For the bullish case, at this morning's lows in the indexes, there was a significant hourly time frame bullish divergence on the MACD followed by swift rebounds.  A move above 202.30 would be a short term chart sign of strength as it would break an hourly chart swing high/resistance.

For index trader's here if long an ETF, I think this morning's low could be used as a stop point.

Pete

Thursday, January 29, 2015

Elevated 5 Day Total Put/Call Ratio - Bullish Implications in an Uptrend

total put/call ratio
Click on Chart to Enlarge

This chart sorts all the days where the closing 5 day simple average of the total put/call ratio was greater than or equal to 1.11 which is the current level.  Notice that the average may stay above that level for several days in a row as a market is down trending.

But some points of notice are that the average 2 month future maximum return was about 1.5 as great as the 2 month max decline since 2012, a period where the market has clearly been up trending.

Also, I have constructed an option pricing model which gives a theoretical maximum gain on an ATM call or put option over the next 2 months.  They are represented by the green and light red columns.  It indicates that over the next 2 months we may expect the call option to gain in excess of 100% while the maximum gain in the put may be limited to 25-30%.  Additionally the way I constructed the model it appears that almost none of the puts were still in a profit after 6 or 7 weeks from the signal day.

So, while there are interesting cross currents here and my timing on yesterday's call option purchase was not great right before the FOMC announcement sell off, from a purely historical basis, it appears that the reward to risk appears skewed to the long side in coming weeks.

A factor that would significantly improve the skew to the long side would be a reversal day where price makes a lower low for the decline but price then closes up for the day and/or where price closes above the midpoint of the daily range.

So if you are not long here or in call options on the US indexes it may be sensible to have it on your radar for a speculative play and enter on an appropriate shorter term chart buy signal (like a 30 or 60 min chart).  I would be looking at ATM or ITM call options with expirations of March (end of month) or later.

Pete

Tuesday, October 21, 2014

SPY Short Trade Set-up


Click on Charts to Enlarge

The top chart here is a 30 min chart of SPY.  The MACD is elevated as price is reaching the 191 area that I have highlighted in recent posts.  I view this level as a shorting set-up and may track some trades here based upon short term technicals and real money sentiment.

The second chart is the VIX on an hourly time frame.  The set-up here would be for the VIX to touch the lower 20 period bollinger band which would be an indication of a potential short term extreme to act upon in contrarian fashion, assuming the larger trend is down, or that a retest of the recent low will occur.  The best set-ups occur when price pushes higher but the VIX fails at least in a very minor way to continue lower as price moves higher.

The bottom chart is the total put/call ratio on an hourly time frame.  Again a move outside the lower bollinger band here would be a possible short term topping signal, though it won't necessarily mark the precise high.

Prices are set to gap up here, and in my opinion a short position at the open would be a reasonable play.  If I go in here it will likely be with SPXU and without a stop on the position.  I will wait for an opposite extreme to develop and exit or place stops when that occurs.


Monday, October 13, 2014

3 Year High in Total Put/Call Ratio Today

Today the CBOE total put/call ratio spiked to 1.53 which is the highest it has been in over 3 years.  Also the VIX is nearing levels last seen in the very large correction in 2011 where SPY declined 21% in 5 months from top to bottom.

So what is the significance of this reading?  Well for those who follow this blog closely, you know that I always point out the importance of divergences occurring at market turns.  And when we see a new extreme like we are in the put/call ratio, that is telling us that "fear" is high, but the fact that there is no divergence present, it indicates that the correction has NOT made a low.

So from this point, we may be close to a rally attempt after a big downer like this, but in my opinion, the rally will be a shorting opportunity on at least an hourly time frame basis.

Given the larger pattern at play here (possibly an ending diagonal in the Dow 30), prices may decline relatively sharply all the way back to the Oct 2013 low.  That would be another 10% lower in the Dow 30.  So just be aware here that if a bull market top is in place, the whole character of "oversold" will take on a new meaning over the coming weeks.

I will continue to update here at potentially important market turns and try to offer contingency plans at each event.

Pete

Tuesday, August 5, 2014

Recent Spike In Equity Put/Call Ratio Above 1.0

Equity Put/Call Ratio Greater Than 1.0 Instances Going Back To 2009

On Friday the equity put/call ratio spike to 1.04.  That is the first time in 3 years that it has exceeded 1.0.  While the initial contrary analysis of this data point is that the market is excessively fearful, I have a somewhat more complete view to offer, I believe.

What is evident going back over the last 2 bull markets and the intervening bear market is that the ratio spiking like this for the first time in a while may be a psychological point of change which is showing a shift to fear entering into the market that has not been present in some time.  This is the type of market psychology shift that I would expect to see as a market is topping.

If you go back through price charts you will see that the ratio spike has typically first occurred prior to an intermediate swing low forming.  So from this we can expect that the market will likely form a least a slightly lower low, which the S&P 500 did already today.

Secondarily, once an intermediate low did form after these prior instances, there were some sharp rebound rallies.  But notice that none of the clusters (even in the current bull market) marked a lasting low.  After some sharp rebounds, price broke to yet lower lows.  So from this tendency - which has been very consistent - I would expect a sharp rebound here beginning within the next 1-2 weeks, but possibly after a further acceleration to the downside.

Next, all three of the last clusters of readings (Jan 2009, June 2011, Aug 2011) all led to 2-4 week rally attempts with the bulk of the rally happening in the first 2 weeks.  So on this basis it may be reasonable to operate under the template that once we see a rally occur, we can look to short or inverse the stock indexes after a couple weeks.

Going back to the topping of the 2007 bull market high, the current market technical analysis set-up is most similar to clusters of readings above 1.0 that occurred in August 2007 and in June 2011.


  • The rally off the August 2007 cluster led to a slight new bull market high, which double topped in the S&P 500 and led to the final bull market high after 8 weeks, on Oct. 11th 2007.
  • The rally off the mid June 2011 cluster led to a slightly lower high in mid July in the the indexes (and a double or triple top on the Nasdaq 100), followed by a 21% high to low correction in the S&P 500.
So given the technical set-up here, in that we are still near the bull market high in prices, and the bullish psychology is still dominant, and the program trading systems are probably still set to "buy the dip", we may expect a rally back toward the highs on an upcoming rally.  The biggest difference at this point, is that the current decline is very shallow in comparison to the price damage that occurred after those highs.  So unless the decline deepens further, it would seem most likely that a new bull market high could very well occur here.


Click on Chart to Enlarge

This chart is the TOTAL put/call ratio with some analysis on it like I have shown in the past.  The point here is that relative to the recent trend the ratio has spiked to a statistical extreme.  That often at least slightly precedes significant lows, but it does put us on alert that the market may be primed to attempt a rally here.

After a similar spike in June 2013, stocks chopped in an up-down-up fashion for a week or so, before falling down another 3+% below the existing low of the correction.  So given the modest decline so far, and the tendency for divergences to occur at the turns, it may be a reasonable idea to go with here as well if we see stocks immediately start to rally from this point.

So hopefully this look back has been helpful in planning and formulating realistic expectations for upcoming market action.  I would suggest being ready for some further volatility.  And also recognize the significance of a high put/call reading as a potential point of recognition or psychological shift in the markets here.  Assuming that stocks don't fall apart from here - although not a safe assumption - the next rally may be a "last ditch" to exit the market on an investment basis before a broad spread sell-off takes place.  That is my take on it.

Thursday, February 13, 2014

Total Put/Call Ratio Analysis and What it Means For Stocks

put/call volume and moving averages
Click on Chart to Enlarge

This chart above show the raw daily total put/call volume ratio with some moving averages and an oscillator type set-up in the bottom pane.  What is easily recognizable is that the oscillator levels have poked up to extreme levels relative to the trend for the last few years.  This indicates that we should expect a bottom in prices to be placed here if the trend is to continue in similar fashion.  Now referencing the chart of the S&P 500 below, look at each time the put/call oscillator rose above the green line and compare those times to the price action of the S&P.

Prices Remain in Uptrend
Click on Chart to Enlarge

We can see that repeatedly when we have seen the fear -as evidenced by increased relative put volume- move to similar levels as we did last week, prices have stabilized and moved higher.  Now it appears that the put/call volume oscillator has time and room to fall again before an potential complacent sentiment is obviously developing.  I would suggest that we expect to see yet higher highs in stock indexes from this point.  An obvious stop loss point could be below last week's low.

Now in addition to the sentiment analysis, any analysis or expectation of price action should be based on past history of price and time data.  And going back to the Oct 2011 low, the largest rallies within corrective phases of price action have been ~3%, 4%, 4%, and 5% lasting from ~5 trading days to ~15 trading days.  So with each day that passes, and an already nearly 5% thrust in 5 days off last week's low, it seems to be reasonable to believe that a corrective low has occurred already and a new uptrend or range will develop.  In other words it would be out of character for the established trend to move any higher and then fail to make new bull market highs before falling below last week's low.

Wednesday, August 21, 2013

Put/Call Ratios Still Tame

One of the reasons that I feel confident that this correction has more room to fall from here is that the put/call ratios have barely budged from optimistic level despite a couple down weeks.

total put/call ratio is still modest
Click on Chart to Enlarge

This chart of the total put/call ratio shows that the 5 day average of the put/call ratio is still a good ways from the 1.05-1.10 range that has been reached on the minor corrections since Nov 2012.  Despite a couple down weeks in the markets, the equity put/call ratio has peak at 0.65 in the last 2 weeks.  Even in the strong uptrend since Nov 2012, minor corrective bottoms have seen ratios in the 0.74-0.80 range or higher.

Given the seasonal weakness typical in Sept., the obvious technical sell configuration, and the lack of fear evident in either the VIX or put/call ratios, I believe we have a minimum of a couple more weeks of downside here until a multi week rally attempt occurs.

I would warn of the possibility of a swift move back toward or below the June lows from here.  I think we may see volatility jump over the next week or two.


Thursday, August 9, 2012

Stocks and Gold Video Update

Click on Chart to Enlarge

Major price highs likely near in stocks and gold.  Bearish divergences are all over the place, and volume is at multi year lows.  AAPL likely set to break down from a failed base pattern.

Sunday, January 15, 2012

SPX At Make or Break Point

Click on Chart to Enlarge

There are some significant potential time relationships that are occurring right now in the S&P 500.  Three potential reversal time points all lined up on Thursday.  The primary time being that the rally off the October low is now 0.618 of the time of the May-Oct decline.  The other relations are represented by the green boxes as a possible ABC relationship, and the purple line which is the same time as the August rally off that waterfall decline low projected up from the Dec low.  Given the price at a breakout point here, this may be a set-up for a failed breakout.  Any technical signal can be used here to enter short if a valid sell comes. 

If the trend is to turn down in the markets from this point, the logical price confirmation would be for the coming move to retrace the entire rally since the Dec low in less time that it took to form.  If that happens, I would consider the trend to be/remain down.  If that does not happen, BUT the market does correct more slowly, then we will likely see another sustained move higher to follow that correction.


Click on Chart to Enlarge


The total put/call ratio is relatively low right now, and extremely so, given the range over the last year.  The market shouldn't have but a few days to make a top in a typical downtrending environment.  I will also note that the longer term put/call ratios are in down trend mode.  So while price is neutral, the sentiment is in bear mode.


Click on Chart to Enlarge

There has been a 7-8 week cycle at play over the last year.  This past week would be due for an inflection point. 

Based on the evidence above, my belief is that the market is unlikely to successfully make a breakout of this level right now.  However, if a reversal doesn't shape up in the next few days and the market remain below the Oct high, then the trend indicators will likely be in up mode on the daily time frame.  Those can lead to steady low volatility up trends.

Monday, May 4, 2009

Housing and Financials Signaling a Top Here???

Click on Chart to Enlarge

First off a couple blog related things......


For anyone that has used the "subscribe by email" feed, my experience is that when I put my own email in there, I do not get the blog updates until the next day, which doesn't do much good for trading purposes. So if anyone knows how to change that or if they have a similar experience let me know to try to figure out how to get it faster.


Also, the "subscribe in a reader" seems to work very nicely as it is simple to do, and every time you use the reader and hit refresh, you will be assured of the latest posts. So that may be the best option out of these two.


Also, I am not really interested in using Twitter on the blog, but occasionally I will have a comment to make that I don't feel justifies a whole post, so I have been and will continue to put those in the "comments" section under the most recent post. Anything important regarding trade management I will always put in a separate post though.


Now to the chart.......I have spent some limited time this weekend trying to look for clues as to what the most likely next direction for the market is because this past week or two has raised some possibility from my perspective for a significant further rally based on the price pattern. However, that does not really match well with the sentiment picture which has been on par (for a couple weeks) with significant imminent market peaks of the past.


I have looked at several things but just used one chart because it is loaded with potential market education. In short, the banking index $BKX is badly lagging the S&P 500 on this recent move to new rally highs. This has been a uniform occurence during bear market rallies during this bear. This would indicate stocks are likely to fall. Also, the total put/call ratio (index and equity) tends to be a leading indicator of future price at turns in that it will form divergences. Right now, that measure is showing a bearish divergence. That is largely because the index option put/call ratio has been rising on this recent rally. That measure is often a smart money indicator as they prepare for near term volatility to increase.


Lastly for this post, the housing index, XHB, is showing a minor non-confirmation the last couple days as it has fallen and is several percent off the highs of last week. More importantly, the chart is showing a compelling pattern both short and longer term that are suggestive of potentially severe weakness the next couple months. The chart above has the notes, but I will add a few here. First, the larger pattern looks like a large upward ABC "flat" pattern since the November lows. The rules associated with this pattern are......


1) waves B and C each have to take equal or more time than wave A.......check

2) if wave B takes substantially more time than wave A, wave C will most likely take about half the time of (A+B).......that is about dead on for the recent high this week.

3) wave B has to retrace more than 61.8% of wave A.....check (in this case since wave B is almost exactly the same size as wave A, then wave C should be almost the exact same size as well, hence the name "flat" due to the double bottom and double top appearance).

4)and here is the biggie.....after the pattern is over, price should retrace wave C in equal or less time than it took to form.


So if this is a flat pattern, then price should drop severely over the next 2 months. The technical indicators and candlestick patterns are both confirming a potential top here as well, so things look strong in support of this case.


So if I had to pick a direction for the market in the near term and intermediate term, I would say "down" from all this evidence.........possibly a major top in the forming. But bank related news, etc. may trump any other factors over the next couple weeks, so I am not extremely confident. Also, Friday looked like it is forming a continuation head and shoulders bottom on the very short term charts. So maybe we will get a gap up and/or test of Thursday's high even if the high does hold.