Click on Chart to Enlarge
In my last post I gave some perspective that gold and gold stocks would likely move higher in the near term. And prices have done just that for the last couple weeks.
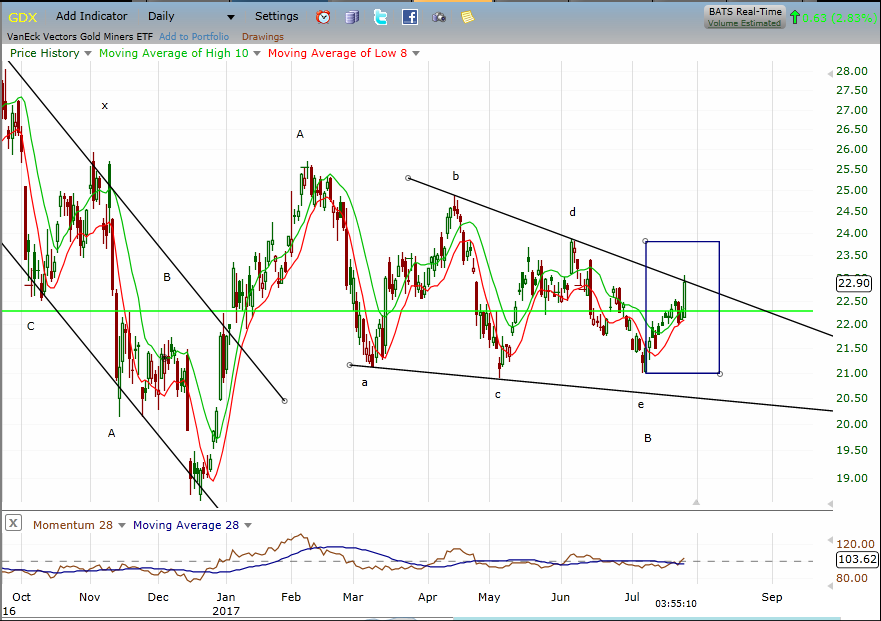
Currently on the GDX etf (shown above), price has moved up and touched the falling boundary line of a falling wedge chart pattern, which I have labeled here as an a-b-c-d-e triangle type pattern.
I'm sure some Elliott wavers would view this progression as an a-b-c-i-ii pattern with the current move up being the early stages of a wave iii, which would be anticipated to be strongly uptrending for a few weeks.
I have put a blue box on the chart to help gauge continued development of post pattern price strength and "price logic". The idea here is that after a pattern or phase of market action completes, the objective signal of that a new phase has begun is that the last price segment is totally retraced in less time than it took to occur.
In this case the blue box represents the price and time consumption of the d-e move as I have it labeled. So if that did indeed complete a contracting triangle/falling wedge, then the logical implication is that the current move up will rise above the top of the box BEFORE the right side of the box is reached (in this case that is August 10th).
Now I can't know that it will or won't do that. But since the price is at a resistance line on the chart and beyond the midpoint of the box, it seems likely that a breakout will occur from the wedge very soon if my perspective is accurate.
It is not uncommon for price to back test a broken wedge line after the breakout occurs. In this case say price moves up out of the boundary lines of the wedge this week. Price may come back down to the approximate price level at which the boundary line was exceeded before moving notably higher.
Pete
No comments:
Post a Comment