Showing posts with label triangle. Show all posts

Wednesday, July 26, 2017

Breakout of Falling Wedge on GDX (Gold Miners ETF) - Probable Continued Price Advance in Coming Weeks

Click on Chart to Enlarge

In my last post I gave some perspective that gold and gold stocks would likely move higher in the near term.  And prices have done just that for the last couple weeks.

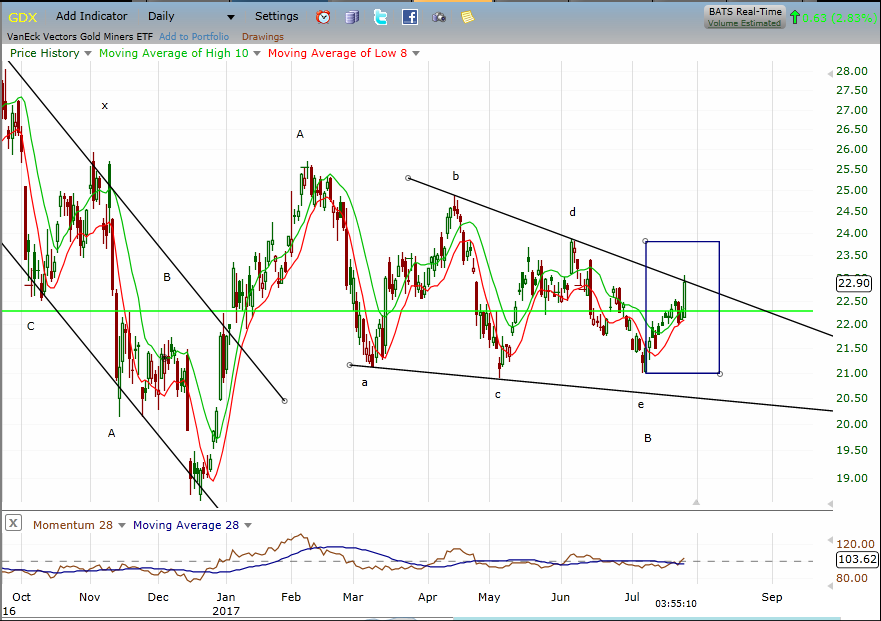
Currently on the GDX etf (shown above), price has moved up and touched the falling boundary line of a falling wedge chart pattern, which I have labeled here as an a-b-c-d-e triangle type pattern.

I'm sure some Elliott wavers would view this progression as an a-b-c-i-ii pattern with the current move up being the early stages of a wave iii, which would be anticipated to be strongly uptrending for a few weeks.

I have put a blue box on the chart to help gauge continued development of post pattern price strength and "price logic".  The idea here is that after a pattern or phase of market action completes, the objective signal of that a new phase has begun is that the last price segment is totally retraced in less time than it took to occur.

In this case the blue box represents the price and time consumption of the d-e move as I have it labeled.  So if that did indeed complete a contracting triangle/falling wedge, then the logical implication is that the current move up will rise above the top of the box BEFORE the right side of the box is reached (in this case that is August 10th).

Now I can't know that it will or won't do that.  But since the price is at a resistance line on the chart and beyond the midpoint of the box, it seems likely that a breakout will occur from the wedge very soon if my perspective is accurate.

It is not uncommon for price to back test a broken wedge line after the breakout occurs.  In this case say price moves up out of the boundary lines of the wedge this week.  Price may come back down to the approximate price level at which the boundary line was exceeded before moving notably higher.


Pete

Wednesday, January 28, 2015

SPY About to Break Out of a Triangle Pattern - Probably to the Upside

Triangle ready to breakout in stocks
Click on Chart to Enlarge

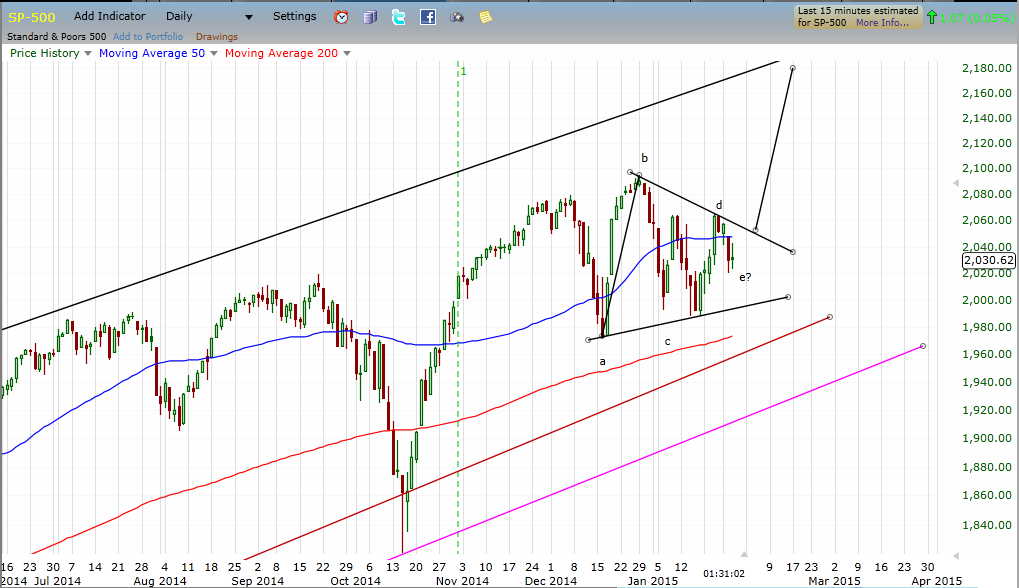
This chart is the cash SP 500 index daily chart.  It appears to me that a counter trend (trend is UP) triangle pattern is forming  since  the December highs.  In any case it is objective that there is a contracting pattern at play as evidenced by the two trend lines formed from the points a,b,c,d on the chart above.  The normal and expected resolution would be for a breakout in the direction of the prior trend.

At the current point, price has pulled back into the apex area of the triangle offering a potential low risk buy point with a stop below point c.  If extending the trend lines to the apex and taking the start point as the December highs, the current point is nearly 2/3 of the way to the apex of the triangle in terms of time.  Most triangle don't stay range bound much beyond that, so my expectation here is that a breakout will soon occur.

Additionally on a short term basis, the price logic favors upside strength until proven otherwise.  Notice that the move up from the Jan 16th minor bottom took 4 days, and now in the subsequent 4 days, there has only been about a 50% retracement of the prior 4 days gain.  This indicates on a logical basis that the psychological short-term pattern trend of the market is UP.  Trends are by definition the direction of the larger moves, and they also often have a higher rate of gain.  So a larger and faster move followed by a slower and smaller move is the norm for a trend.  In this case I would place the odds of future upside strength to be well above sustained downside strength.

It appears most likely to me that an upside breakout will coincide with a broad based strengthening in commodities and a major pop higher in the price of energy shares which have been pummelled recently.  Additionally, given the intermarket correlations, I would anticipate a weakening in US bond prices and a corresponding move higher in yields if this scenario plays out.

From a long term cycle standpoint, the most common time frame for bull markets in US stocks to peak has been the 6th or 7th year of the decade.  And the 5th year of the decade is invariably a positive year in the history of our stock market.  These factors would provide some historical argument for expecting the resolution to be to the upside here as well.

On a shorter-term seasonal basis, the mid-October through April time frame has historically been the most bullish in US stocks for whatever reason.  So that is another factor here that would suggest having a long side bias for the coming breakout with a probable trend continuation up into the spring of this year.

A breakout to the upside would have a target from 214.00 to 218.00 on SPY if measured up from the apex of the triangle or from the likely breakout point in my estimation.

I have purchased an April 203 call option on SPY for 5.50 in anticipation of such a move beginning soon.  I will update as to future trade management on this option.

Pete