Click on Chart to Enlarge
Yesterday the total put/call ratio spiked to 1.46 which is in the upper end of the historical range. So looked at what this may mean for us moving forward.
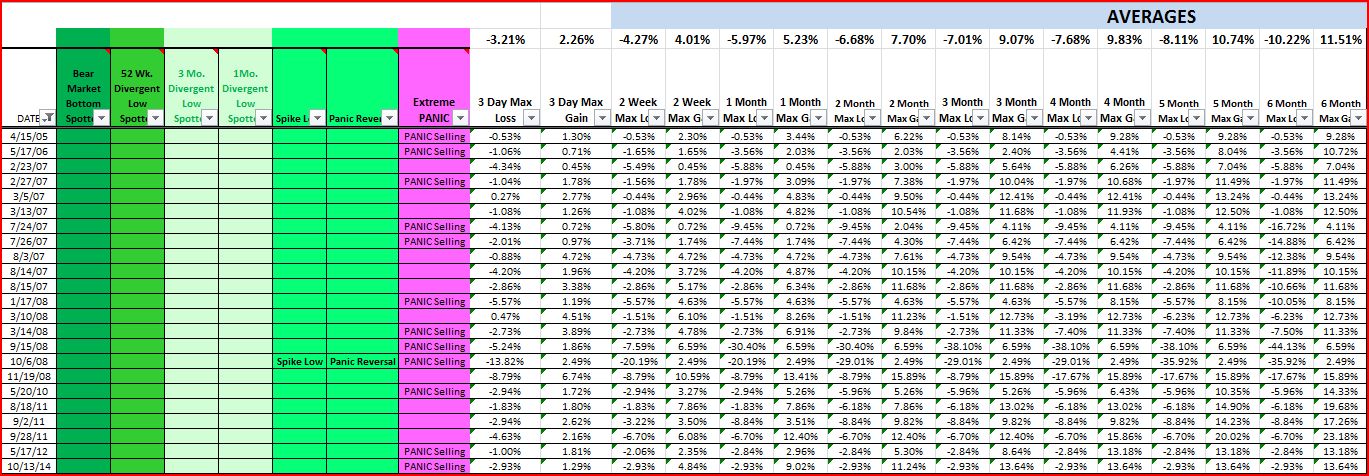
The table above shows times when the total p/c ratio was above 1.4 going back to 1995. It also then selects only those times when the close was not greater than 0.61 of its daily range. So basically I am filtering out day where the ratio is very elevated but prices manage to stage a close in the upper portion of the range. This weeds out a few significant bottom reversal days which the action was obviously different than yesterday's low close.
What we see is that there is a greater max loss than max gain on average over the next month.
In just under half of the instances, all the max loss over the next month occurred within the next 3 trading days. So that suggests that we will see likely lower lows coming relatively soon after Thursday's rally attempt. But then there may be a more sustained rally attempt from a lower low starting point.
Since Thursday (today's) trade is gapping up significantly, we can look at times when the next 3 days did not make significant lower lows. On the table above there are 4 out of 23 times. And in 3 of them, the 2 week max loss is still greater than the 3 day max loss. That suggests that of the times when the rally was immediate, prices still faltered after a brief spurt higher. This suggests that after a couple days rally attempt here, prices may be likely to make lower lows for the move within the next 2 weeks. That seems to me to be an ideal set-up for a near term put option purchase.
So say price rallies to 208-210 on SPY by tomorrow/Friday. These stats suggest that more likely than not, price will continue to make lower lows over the 2 weeks relative to Wednesday's close. In fact, out of the 23 instances above, EVERY one made a lower low. So the set-up would be that after a brief rally here, price will move back below 204 on SPY by the week ending July 24th. So use that info to your advantage for short term put option trades if we see a little further push higher here the next day or two.
Pete
Looking through some charts, buying the XLF 25 strike put expiring July 24th would be a nice play in my estimation if price moves up for another 1-2 days.
ReplyDelete