Showing posts with label call option. Show all posts

Monday, August 21, 2017

SPY Aug 25th 243 call Option Entry

Click on Chart to Enlarge

After the set up of the big rise in the VIX last week, I had laid out a trade plan to buy a near term SPY call.

However, as of last week, despite a sharp drop in SPY, there was not even a 15 minute chart bullish divergence, present, and so I felt that it would be likely for at least a poke lower to create some divergence before a multi day rally occurred.

And that is what happened this morning, with a nice 15 and 30 minute chart bullish divergence after a slightly lower low than Friday's.

I entered a little bit off this morning's low, and bought the Aug 25th 243 strike call.

I went through the stats from last week's post and found some data corruption in my spread sheet which altered the stats somewhat.  The win % on the set up is ~80% rather than 90% and the optimal limit exit is 60% gain rather than 80%.

So I am using actually a 50% limit gain from last Thursday's close which is the trigger day of the study and the comparable price for the backtests.  And since the price of the option was currently lower, I am lowering the limit exit slightly to increase my probability of a profit on a short bounce back up to 244 to 245.

I have a limit order of 2.50 in for the exit, which would probably take a move back up to near 245 by mid week to fulfill the exit limit order.


Pete

Thursday, August 17, 2017

Another Short Term Bullish Set-Up - Great Call Option Opportunity on Backtest 8-17-17

Today SPY sold off hard similar to what occurred last Thursday.  The VIX rose 32% on the day, similar to the huge rise last Thursday.

Based on the back tests I've run, this is not really bullish over the intermediate term.  The closing returns on SPY at 1 month after the signal has been barely positive, which is worse than normal.

But over the short term, particularly for about 1 week, the back tests are positive, with average positive closing returns on SPY being more than +1% at the 4 and 5 day marks after the signal.  Then the gains start to fade to near 0 at 1 month after the signal.

However, the SKEW to MAX gains versus MAX losses over the next 5 days is a paltry 1.09, meaning that the average maximum gains are barely bigger than maximum losses over the next week. Basically what this means is that there were some big downers in the group, rather than a consistent tendency to trade in the positive without much downside.  That small skew and real possibility of some big downside is not what I want to see for taking an equity trade.  So I would avoid a simplistic long trade here on the equity ETFs.

That being said the tendency to rebound to some degree is so consistent, that the options have provided an outstanding profile for profit over the week following these signals.  Every instance flagged in the backtest of about 22 instances has shown MAX gains of 0.96% or more in SPY over the next 5 trading days.  And that has translated to some consistent gains in the weekly expiration call options.

The following table shows stats based upon my model for the forward change in the option price for an at the money call option with 5 days until expiration.  And the results here are ~90% of the past instances made MAX gains of 80% or more on the call option during the next 5 trading days.  The way I construct the model is actually conservative (it is not based on actual contract data), and so in reality the results are probably even mildly better than this.


So the strategy here would be to purchase an at the money SPY call option with an August 25th expiration and then set a limit order to exit at 80% gain in price.

Now digging deeper into the past instances near term behavior, about 3/4 of the past instances showed at least some intra day loss on the day following the signal, and the average intraday drawdown was pretty high at ~1.5%.  So this would argue that the odds favor setting a limit order to enter the trade that is equal to today's closing price for the option or lower.  For those with skill in short term analysis and ability to watch the markets, could watch a short term intraday chart tomorrow to see if short term bullish divergence develops on the technical analysis, at which point an entry could be made at the market.

The following table shows some of the MAX gains in the call options and some of the dates for you to reference the charts.  There are previous instances that dont fit on this screenshot.


The past instances show that if the day following the signal gaps DOWN, then there is a strong tendency for a short rebound to follow and for the day to close higher than the open by a wide margin.

Also if the next day gapped UP, then the future returns in the ETF itself are more negative.

So to translate this into an action plan, if SPY gaps up tomorrow, I WON'T buy the option at the open.  But if it then trades lower during the day and creates some short term bullish divergence, then I will buy and set the limit gain order for 80%.

If SPY gaps down, I will buy the Aug 25th expiration at the money SPY call option at the open and set a 100% limit gain to exit.

Monday, January 11, 2016

4 Closes Below Lower Bollinger Band In a Row in SPY - Very Bullish Historically

The stats are phenomenal for a 1 week bullish trade on the indexes after 4 consecutive closes below the lower bollinger band in SPY.  That criteria was met today.  Going back 20 years, there are only 21 days that meet that criteria.  The forward 3 day max gain is 4 times as large as the max loss, so the set-up is great for an equity trade.  Only 4 out of the 21 days have led to maximum option gains of less than 50% over the next 5 trading days if buying ATM options from today's close with 5 days until expiration.

If setting an equity trade with equal profit and stop limit orders, a 12.5% limit combo provided maximum expected value of about 3.35% in 3 days.  Exit the trade after 3 days (in this case by Thursday's close) if the limit orders are not hit.

The option trade maximum expected value is to set a limit order of 130% and buy the weekly ATM call, in this case Friday's standard Jan 15th expiration.  There have been 15 winners and only 6 losers in the historical 21 instances.

Based on the past instances the next day began on average with a gap up, but about half the instances traded below the previous day's closing price.  15 out of the 21 instances experienced at least 0.5% loss after the opening on the follow day.  So these numbers suggest that if you did not get in by today, then setting a limit order a little below the open tomorrow would be a reasonable probability to get filled and still have the lion's share of the move likely to play out to the upside.  Of course, if the gap is very large tomorrow, that could skew the risk reward.

So the pieces are in place for a nice rally here for the rest of the week.

Let me know if there are any questions regarding trading from this analysis.


Pete


Friday, January 8, 2016

Even More Bullish Call Option Set Up - 3 Consecutive Closes Below Lower Bollinger Band

Click on Stats to Enlarge

Going Back a little over 20 years in SPY, there have been 47 previous instances before today, of 3 consecutive closes below the lower daily bollinger band.  The statistics above show the option trade stats for buying an ATM call option with 1 week until expiration and setting a limit order to exit at 130% gain or exiting at expiration.  This limit order provided the optimal expected value.

This is a very simple scan but is a very powerful set up historically.  Over the next 5 trading days, the MAX gain has been twice as big as the MAX loss in SPY.  This skew provides a profitable equity play here as well on the long side.  Setting a loss limit of 12.5% and a profit limit order of 12.5% has led to an average gain of 2.34% in the past history if exiting at the close 5 days later if the limit orders were not hit.

Pete

Thursday, December 10, 2015

Update on a Few Recent Scans - Call Option Opportunities

I have run a couple scans over the last 4 weeks which I did not take time to post on here.  But I wanted to show a couple recent simple scans which identified short term option opportunities which worked beautifully.  Also there is scan I ran last night highlighting a short term call option opportunity.

The last post I made on 11-13-15 noted a bullish short term technical set up and suggested that stocks may see a short term rebound.  I ran a scan of past similar conditions as follows:

  • 3 days in a row closed down
  • today's close was down more than 1%
Trade Stats for Scan

Based on my option pricing model there was a 74% win rate in buying an ATM call option with 1 week until expiration and setting a limit order of 50% to exit the trade.  That limit order ended up being hit the net day on a big rebound in stocks.

I ran another scan on 12-3-15 after a big 2 day sell off.  The scan looked at past times with the following criteria:
  • 2 days in a row closed down more than 1%
  • 63 day EMA was pointed up (to filter for intermediate uptrend rather than during a more oversold market)
Trade Stats for Scan

The past results showed only 15 instances, but ~73% win rate when exiting with a limit order of 69% on an ATM call with 1 week until expiration.  That limit order was hit the next day again on a big 1 day rebound last week.

Currently we have a some what similar set up occurring, where SPY has closed down 3 days in a row.  The intensity has not been as dramatic, and yesterday was only a 0.78% loss.  But I ran a scan with the following conditions:
  • close down 3 days in a row
  • today closes day more than 0.75%
  • Daily MACD is down
  • Weekly MACD is up
  • Daily MACD is above 0
  • High-Low range is less than 2%
It is a more detailed scan but helps to weed out times when the market was more oversold and in a predominant downtrend, often associated with higher volatility conditions than currently would be expected.

Trade Stats for Scan

The data on all these scans only goes back to last 1995, but there are still plenty of instances to get a look at how markets behave in similar instances.  In this case there were 24 instances with ~79% win rate when setting a limit gain of 50% to exit the option (ATM with 1 week until expiration) relative to Wednesday's close in this case.

So the implication is that the market may rebound in the short term.  However I don't like the technical analysis set up as much here.  I would rather see some further oversold or bullish divergence develop on the hourly MACD. 

The chart pattern on the daily SPY chart is a contracting triangle, with price at the lower boundary.  So maybe stocks are set to rebound from here.  And a contracting triangle typically has a significant price break to follow.

It may not be fruitful to over analyze here, but hopefully these stats and the associated short term technical analysis will be helpful for trade decision here or over the coming few days.


Pete


Thursday, September 3, 2015

SPY Call Option Profit Limit Hit Today

Basis the SPY Sept 11 192 strike call from Tuesday's closing price, the 70% limit order was hit today.  So the trade is closed as far as my recommendation and tracking here on the blog.

I think a nice put/short opportunity will arise if price is able to push back up above today's highs with in the next couple days.   If price rallies modestly tomorrow, I may enter a bearish option position going into the weekend.

From the stats posted earlier this week about 3% down days, there was a clear tendency for a short term rebound, but the future returns turned overall negative as time moved forward.  And at 3 weeks out, the average closing price was about 4% lower than the average close 1 week out.  So since price has rallied a bit already, it would seem that looking out a couple weeks, we could see a pull back.  That is totally in line with the closest historical fits from the charts, and is backed up by the objective historical stats.


Pete

SPY Call Option Follow Up - Exit Plans

The suggested ATM SPY call options from earlier this week should be entering the exit zone today.

So based on the stats we looked at, setting a 40% limit order should be a very high probability of success trade.  That limit order looks like it will hit this morning.

I had suggested using a 70% limit order to exit the trade.  If price moves up a little further into the gap down from 198ish, that order will likely hit.  So, I don't have anything new to offer other than possibly suggesting a scaled exit taking part of the position off at 40% gain, and then using the 70% limit order for the rest of the contracts.


Pete

Tuesday, September 1, 2015

SPY Gap Downs of Greater Than 2% - Short Term Bullish Option Play

Today SPY gapped down over 2%, and so I looked at other times when SPY gapped down over 2% while the weekly MACD was down.  The short term stats show a clear upside bias for about a week.  The peak closing gains in the short term were 6 days out.

Looking at the options part of the assessment, based on my pricing model, an ATM call option purchase with 2 weeks until expiration would provide the maximum value play.  The maximum expected value would be to enter the trade and set a limit order of 160% gain to exit.

Local maximum expected values occurred at 40%, 80%, and 160% limit orders.  The stats below show the overall trade stats.  Given the current market environment, I feel that the 40% or 80% limit order would be more appropriate for the market overhead resistance.

Which ever the case, they are positive EV plays, and the position sizing would vary depending on the exit limits.  The Kelly Bet % will give guidance on that.  And psychologically, an 80% win rate trade like the 40% limit order is nice in that it gives frequent wins and reinforces sticking to solid trades and planned exits.


This shows the stats for a 2 week till expiration ATM call exited with a 160% gain limit order.  This gives the maximum expectation at 30% per trade.


This shows the stats for a 2 week till expiration ATM call exited with a 80% gain limit order.  This has a higher win % at 66% but a little lower expectation.


This shows the stats for a 2 week till expiration ATM call exited with a 40% gain limit order.  This gives the maximum win rate at 80% but a lesser expected value of 12-13%.

I personally took the trade and have the 40% limit gain order in place to exit, which would happen on only a partial fill of today's gap down within the next couple trading days.


Monday, August 24, 2015

MU Call Option

I purchased a Aug 28 expiration 15 strike call on MU for 0.58 per contract this afternoon.

Click on Charts to Enlarge

The daily charts show a pronounced bullish divergence  in the MACD indicator.  And while the session has not closed yet, so far the probability looks quite high that MU will form a bullish engulfing pattern on the day.

Given the trade stats shown over the weekend on SPY, it seem likely that stocks will continue to attempt a rebound for another couple days at least.  A fill of the last couple unfilled gaps on MU over the next couple days would push the trade to 100% or more profit. 

I am setting a limit sell order @ 1.80 to close the trade on a potential move higher from here.

Friday, August 21, 2015

Massive Sell Off Suggests Short to Intermediate Term Rebound in SPY

Click on Chart to Enlarge

The snip above show a study of SPY performance after 3 closes down in a row and the most recent close down being more than 2% as we saw on Friday.  The filter also includes the weekly MACD in the down position.

The stats look at the performance of buying an ATM call option with 1 week until expiration and setting a limit order of a 50% gain after entry.  Any loss assumes 100% loss on the position.

There have been 77 trades going back to 1995.

83% of the trades would have ended up reaching the 50% limit gain before expiration making a hugely profitable trade.  The expected value is over 24% per trade.

Additionally while not shown here, only 4 out of the 77 trades did not show a lower low in the next 5 days.  So it seems likely that next week will have a slightly lower low (at least slightly) followed by a sharp rally.  This makes it sensible to place a limit order to buy the option at or below this Friday's closing price to help solidify the reward to risk picture.

The stats are even stronger for 4 days down in a row which also occurred into Friday's close.  And the stats are even stronger for the 4th day being down greater than 3% which also occurred on Friday.  However the instances are more sparse.  But the optimal play there would be to place a limit order of 100% for the 1 week at the money option.

Out of the 77 instances, 44 gapped up the next trading day.  So more often than not the market gapped higher.  But we also see that almost 95% of the instances a lower low was made in the next week.  So if Monday opens with a gap up, the suggestion would be to wait for price to come down to buy the option.  In other words, if there were a clear indication that Monday was more likely to gap DOWN, then the suggestion would be to buy the option at the open Monday.  But since that has not been the case, simply waiting for a lower low to be made (below Friday's CLOSE, not low) seems to be the best strategy.

Of note also for past stats.....if the next day gapped up 1% or more, and then price fell below the previous day's close within the next 3 days, then 7 out of 9 instances showed 100% or greater gains, which is even stronger than the other stats.  So that suggests that if Monday gaps up, and then price moves below Friday's close, we still want to enter the trade, but switch the limit gain order to 100% for maximum expected value.


So the play here is to buy the Aug 28th expiration SPY 198 call for a limit of 3.50 either Monday or Tuesday.  If filled, then set a limit order to sell the option for 5.25 after entry.

If the order is not filled by Tuesday, I would suggest switching to the next week expiration for trades and re-assessing the action.

From the trade stats of the closest fit scenarios, it seems that SPY is likely to rebound to fill the 8-21-15 gap down (or at least very close) at some point next week.

Stats are available for playing the equity side of this as well.  If you need those, please comment what your question is and I will try to assist.


Pete

Tuesday, July 7, 2015

Bullish Short Term Divergence at Today's Reound Attempt In SPY - Forward Results Suggest 3-10 day Rally In Store

Click on Chart to Enlarge

Today's upside reversal in SPY comes in conjunction with a pronounced bullish divergence on the hourly MACD, and pronounced bullish divergences in VIX and put/call ratios.  The stage is set for a rally attempt that could be substantial based on past instances.

The signal generated today is a "3 month low" in my bottom spotting algorithm.  Times since 1995 which have occurred in a rising bull market moving average (1 year average is up) are highlighted above.

Of note is the 2 week time frame after the signal which shows an average max gain to max loss of about 2.3:1.  11 out of 15 instances showed 2 week max gains of more than 3%.  8 out of 15 showed 2 week max gains greater than 4%.

If buying ATM options with 2 months until expiration, the max gain on the call was also about 2.3:1 versus the put.  And the average max gain was 168%.   About half the instances made max gains in excess of 150%.  So if you do the math on that, it would be a very profitable trade over time to buy the call and set a limit sell order of 150%

Since the max rate of gain here is within the 2 week time frame, it seems that buying an ATM call, and setting the 150% limit order would also be a profitable trade with pretty quick expected turnaround time.


The possibility is certainly that the market will rise rapidly to fill last week's gap down, and there may be no retest of the lows today.  However, the tail is so long on today's candlestick, that from experience, I would think that a retest of the mid point of the tail on today's candlestick is probably as or likely or more likely than not.

So my strategy here is to place a limit order of 2.50 to purchase a July 31st SPY 208 call.  The ideal would be for a choppy retest of today's low over the next couple days, followed by a surge higher to above 210 at minimum.

When the signal is filtered for a down trending 1 year moving average, the 3 day time frame shows a 2.85:1.85 max gain versus loss, still suggesting a probable 3 day potential rally.  After that, all time frames displayed greater max losses than gains for those time frames shown.

So another option here would be to simply open a near-the-money trade, and close it before Friday's close. 


Pete

Thursday, February 26, 2015

Sell Signal For SPY Call Option

Yesterday my index option trading system registered a sell signal for the recent call option purchase.

The first sell signal does not tend to be right at a top of a leg up, but may often be right near the end of a directional portion of a move.  So I would suggest exiting at least part of a position at this signal.

The SPY option I purchased is currently up around 80%.  I have a market order to exit at the open today.

The hourly VIX chart is displaying what I consider a short term extreme configuration in the bollinger bands, and so a brief pullback here would be reasonable if not expected.

Sunday, February 15, 2015

CHK, OAS, SPY and The Possibility of New Highs for the Nasdaq

Just a quick note here on a few of the stocks/options that I have noted in recent weeks.

CHK and OAS report earnings 2/25/15 before the open.

The sentiment backdrop on CHK is showing considerable pessimism in that the near term put/call open interest is almost at an annual high and the short interest is at an annual high and has increased by almost 29 million shares since 12/1/14 at which time the closing price was similar to the current price level.  This seems like a scenario where the bearish backdrop could lead to considerable continued buying interest if prices push higher.  I am still holding an 18 strike April expiration call option on CHK with plans to hold through earnings.

On SPY where I had mentioned a call purchase on 1/28/15, price has moved to new all time highs.  There are bearish divergences present in several areas, but there are few extremes to suggest that the current move up is overdone.  When price moves to new highs in the stock market, often times price is able to advance steadily on low or declining volatility.  Given the apparent upside breakout of a large contracting triangle, it will be interesting to see if prices are able to sustain a major advance.


Click on Chart to Enlarge

The Nasdaq Composite is only about 5.5% away from a new all time high currently.  It seems likely to me that price will exceed that high before a major correction occurs.  An ideal scenario may be a rather directional move up from here to eclipse the tech bubble highs with a good bit of fanfare.  Then that may be followed by a correction, or at least a pullback several % below the highs to punish the breakout buyers.

Pete


Thursday, February 5, 2015

DDD Technical Analysis and Short Interest Analysis

DDD with heavy short interest
Click on Chart to Enlarge

This chart is a daily chart of DDD.  I bought a May 29 strike call on it yesterday.

The technical position of the stock is compelling for a rally here in my opinion.  Price has under cut a low from March 2013 (not visible on this chart) and reversed higher here.  Stochastics is showing a weekly and daily bullish divergence on the low Tuesday in conjunction with a very high volume gap down and under cut of the January lows only to reverse and close in the upper end of the range and above the January lows.  This has the appearance of a failed break of support which often provides a high quality long entry.

There is money flow index bullish divergence on the recent leg down, indicating that the downtrend is running out of steam.

The stock is heavily shorted with 33% of the float short as of 1/15/15.  The short interest ratio is 12.5 which is rather high and indicates plenty of short covering potential on a rally.  While I don't have detailed data on the underlying short squeeze trigger price, I am estimating that a rise to the $35-38 level will likely cause some short covering based on the short interest increase from October to December.

Another factor here is that earnings comes out 2/26/15 before the market opens.  Given the oversold technical position of the stock with bullish divergence, I would give better than even odds to a bullish response during this earnings period.

Pete


Tuesday, February 3, 2015

NUE Call Option - Steel Should Be Rallying Too

Click on Chart to Enlarge

This chart is a daily of NUE which is in the steel and iron industry.  Along with commodities, steel stocks have taken a major beating in recent months.  And it is a place to bottom fish for big reward opportunities currently in my opinion.

Notice that as price has moved lower the last couple weeks, the money flow index has made progressively higher peaks, indicating that the trend may be set to reverse.  Now we are seeing a pop higher from a fibonacci support zone and a major, multi layered bullish divergence.

I believe this stock has good potential for continuation higher.

I have an order to buy an April 44 call option for 2.35 or less.  It would take a mild 1% or so pullback for the order to fill, but given the very short term overbought nature of these materials stocks right now, I think it has a good chance to make that pullback, and that will also create a more favorable reward to risk scenario for the option.

Pete


Thursday, January 29, 2015

Elevated 5 Day Total Put/Call Ratio - Bullish Implications in an Uptrend

total put/call ratio
Click on Chart to Enlarge

This chart sorts all the days where the closing 5 day simple average of the total put/call ratio was greater than or equal to 1.11 which is the current level.  Notice that the average may stay above that level for several days in a row as a market is down trending.

But some points of notice are that the average 2 month future maximum return was about 1.5 as great as the 2 month max decline since 2012, a period where the market has clearly been up trending.

Also, I have constructed an option pricing model which gives a theoretical maximum gain on an ATM call or put option over the next 2 months.  They are represented by the green and light red columns.  It indicates that over the next 2 months we may expect the call option to gain in excess of 100% while the maximum gain in the put may be limited to 25-30%.  Additionally the way I constructed the model it appears that almost none of the puts were still in a profit after 6 or 7 weeks from the signal day.

So, while there are interesting cross currents here and my timing on yesterday's call option purchase was not great right before the FOMC announcement sell off, from a purely historical basis, it appears that the reward to risk appears skewed to the long side in coming weeks.

A factor that would significantly improve the skew to the long side would be a reversal day where price makes a lower low for the decline but price then closes up for the day and/or where price closes above the midpoint of the daily range.

So if you are not long here or in call options on the US indexes it may be sensible to have it on your radar for a speculative play and enter on an appropriate shorter term chart buy signal (like a 30 or 60 min chart).  I would be looking at ATM or ITM call options with expirations of March (end of month) or later.

Pete

Wednesday, January 28, 2015

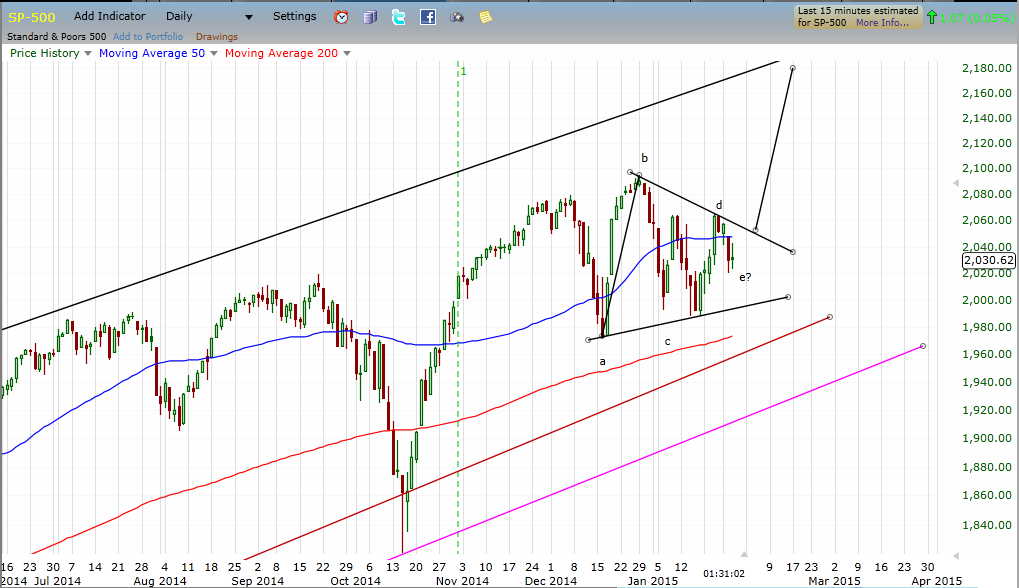
SPY About to Break Out of a Triangle Pattern - Probably to the Upside

Triangle ready to breakout in stocks
Click on Chart to Enlarge

This chart is the cash SP 500 index daily chart.  It appears to me that a counter trend (trend is UP) triangle pattern is forming  since  the December highs.  In any case it is objective that there is a contracting pattern at play as evidenced by the two trend lines formed from the points a,b,c,d on the chart above.  The normal and expected resolution would be for a breakout in the direction of the prior trend.

At the current point, price has pulled back into the apex area of the triangle offering a potential low risk buy point with a stop below point c.  If extending the trend lines to the apex and taking the start point as the December highs, the current point is nearly 2/3 of the way to the apex of the triangle in terms of time.  Most triangle don't stay range bound much beyond that, so my expectation here is that a breakout will soon occur.

Additionally on a short term basis, the price logic favors upside strength until proven otherwise.  Notice that the move up from the Jan 16th minor bottom took 4 days, and now in the subsequent 4 days, there has only been about a 50% retracement of the prior 4 days gain.  This indicates on a logical basis that the psychological short-term pattern trend of the market is UP.  Trends are by definition the direction of the larger moves, and they also often have a higher rate of gain.  So a larger and faster move followed by a slower and smaller move is the norm for a trend.  In this case I would place the odds of future upside strength to be well above sustained downside strength.

It appears most likely to me that an upside breakout will coincide with a broad based strengthening in commodities and a major pop higher in the price of energy shares which have been pummelled recently.  Additionally, given the intermarket correlations, I would anticipate a weakening in US bond prices and a corresponding move higher in yields if this scenario plays out.

From a long term cycle standpoint, the most common time frame for bull markets in US stocks to peak has been the 6th or 7th year of the decade.  And the 5th year of the decade is invariably a positive year in the history of our stock market.  These factors would provide some historical argument for expecting the resolution to be to the upside here as well.

On a shorter-term seasonal basis, the mid-October through April time frame has historically been the most bullish in US stocks for whatever reason.  So that is another factor here that would suggest having a long side bias for the coming breakout with a probable trend continuation up into the spring of this year.

A breakout to the upside would have a target from 214.00 to 218.00 on SPY if measured up from the apex of the triangle or from the likely breakout point in my estimation.

I have purchased an April 203 call option on SPY for 5.50 in anticipation of such a move beginning soon.  I will update as to future trade management on this option.

Pete

Sunday, January 18, 2015

OAS Call Option and Short Interest Analysis

Click on Chart to Enlarge

This daily chart is of OAS which is Oasis Petroleum, an oil correlated equity.  I have a order to purchase the February 15 strike call option.

According to data on Schaeffer's Research, there has been a near doubling in the amount of shares sold short from the Dec 1 to the Jan 1 reporting period.  As of the current data, there is over 24% of the float sold short.  This is obviously an indication of pessimism on the stock, which seems justifiable (and profitable over the last several months).  Nevertheless it does create a large potential supply of buying power in this stock if prices rally and put the shorts at a loss.

A bit of my logic on this is indicated on the chart above.  The light blue moving average is the simple average price since December 1st at which point 8.61 million shares were sold short.  As of January 1st 16.91 million shares were sold short.  So basically we have seen a huge increase in the number of shares shorted since December 1st.  And I don't know exactly were they were shorted, but just using the average price and assuming they were relatively evenly shorted during that period, then that would put the average price shorted at about 15.00 (or maybe 15.90 if using the high of each bar for the average).  So if prices rise above the 15.00 level, that would possibly put the average short position at a paper loss at that time.  And then any further rise will put those newly shorted shares at an even further loss, creating pressure to cover the position.  Covering is done by buying the shares, and so that would be significant buying interest forced into the stock.

Additionally, price this week did not even come close to making a new low for the decline despite oil's new low.  This again is a non-confirmation with the commodity that may be a sign of bottoming in the sector and relative future strength in this stock.  Furthermore, a move above the December 23rd high would be a stop loss point on the chart, and again, given the hefty short interest, may lead to a short covering burst of buying.  There is a large heavy volume unfilled gap down above that at 25.24.  If oil is bottoming here and going to stage even a bear market rally, that $25 level would be a likely target for OAS in my opinion for the coming weeks.

So my plan here is to buy the call with the expectation that we may see prices rally in the next 5 weeks and make a significant gain in the option.  If buying, a simple strategy could be to enter a limit order to sell half the position at 100% or 1/3 at 200% gain and then hold the rest assuming prices appear to be moving higher.  Then a more finely tuned final exit can be sought.

But the set-up here looks good for an equity purchase as well with the same overall trade logic.

If there are any follow up questions to this analysis or oil related issues, reply here and I will try to assist you.  I view this oversold oil sector and the XLE etf as a prime opportunity for profit at the current time.


Pete


Friday, January 16, 2015

CHK Option Trade

Click on Chart to Enlarge

I purchased a call option position on CHK today for 2.48 April 18 strike call.

CHK is an energy related stock, which is in the oil industry which obviously has been hammered down in price recently.

However, there are some signs that the oil downtrend may be near exhaustion, and that CHK may be one of the sector that is showing relative strength on the charts.

Notice that oil has been making new lows into this week.  However, CHK bottomed with a double bottom reversal on 12/12/14.  Now on oils push to new lows, CHK has held well above the the 12/12/14 low.  This creates a non-confirmation with the underlying commodity and is a sign that CHK is basing and ready for a move higher.

A subtle note on short interest is that during this downtrend, the short interest has consistently risen as CHK has rallied and then declined as price declined.  The same pattern did happen again as price rallied in CHK into late December.  HOWEVER, now that price has declined but did not make a new low, and there is the real possibility of a break above the December highs if oil strengthens, then it seems likely to me that there would be some short covering forced on a break of that price peak around 20.40 on CHK.

For stocks one could be long with a stop below this week's low, and then exit at a limit of 23.04, which is the fill of a large gap down.  That would be a solid reward/risk play, and one with a clear logic behind it.  I am in the call option with plenty of time for a significant move and, in my estimation, a very good probability that this option will at least double in price at some time prior to expiration.  The key will be to make a timely exit or scale out if prices do rise.


Let me know if there are other oil related issue that you would like looked at.

Pete

Thursday, August 14, 2014

DBA Call Option and Technical Analysis

Click on Chart to Enlarge

This is an hourly chart of DBA, which is the PowerShares Agriculture fund.  I purchased some call options near the close of today's session.  I bought the Sept 26 calls for 0.50 a contract.  The spread was about 0.05 which is 10%, but given the possibility of a 100% + move in the options over the near term I settled for it.

The chart above shows a beautiful bullish divergence on the momentum as it hit today's lows.  But I would suggest looking at the multiple time frame set-up as well.  The daily MACD and momentum are showing classic bullish divergence as well between the two major lows visible on the chart above.  Additionally, the weekly stochastics is over sold and with some mild bullish divergence.  So it appear that today could be the trough of a potential multi time frame turn higher.

Looking at the last portion down of the chart above I have labeled a nice looking Elliott wave style 5 wave impulse.  So at this point given the obvious loss of momentum and the possible failed break below the July 11th low, it appears likely that we see at least a partial retracement of the last move down over the last couple weeks.  From looking at the daily chart, it seems that a move back up to the 27.00 level could be quite likely.

If prices do indeed rally here, and completely retrace the last two weeks downward move in LESS time than the decline took to form, I believe the logic would be that a new upward pattern was at play, and that we could probably expect prices to rally well above 27.00 in coming weeks.  The pink vertical lines show the current forward time projection as August 29th the date prices would need to move above 27.00 by in order to confirm this.

So given that possibility I just bought the Sept expiration calls anticipating a quick rally to 27.00, with possibly a move well above that.

My current exit plan is to simply maintain the option with no stop loss and am willing to hold until expiration even if it results in 100% loss.  That is factored into the amount risked/put into the trade.  I currently plan to exit half the contracts at 100% gain if prices rally modestly from here.  HOWEVER, if prices rally very swiftly (3-4 days) back above 27.00, then I will opt for holding all the contracts and use the daily chart as a possible exit indicator prior to expiration if a divergence develops.

So part of the logic is that a rapid retracement of this last decline would suggest a likely new pattern occurring, and with the 26 strike option, it would seems likely that the option would expire in the money and that the 26 level would be a significant support level.  And so I would like the opportunity to make a larger gain on the whole position if everything develops in ideal fashion.

Click on Chart to Enlarge

This chart is a daily chart with two projections up from this low that simply project the 2 prior significant rallies visible the chart up from today's low.  In both instances we see it would be likely that the option could expire in the money and probably make 100% gain along the way.  But if we see a significant rally even close to the green projection line, then a 400-500% gain on the option would be possible.  So while I don't EXPECT that, I want to plan for the scenario that makes the big money and maximize it by holding the whole position if price explode up from current levels indicating a possible intermediate low is in place.

Pete