Monday, July 13, 2015

Stock Index Commitment of Traders Data Suggests Strong Bullish Run Ahead

I took time this evening to review the recent Commitment of Trader's data compiled for the major US stock indexes.  And there has been a large move of smart money into the long side of futures in the last 2 reporting periods.  As of this past week's reporting period this has actually pushed the smart money "hedgers" to a net long position.  They typically are net short and have not gone net long at too many points in recent years.

The last two period of time where they moved from extended net short to a net long total where at distinctly significant lows.
  • August 16th 2011 - Dec 27th 2011 was mostly net long by commercials
  • July 6th 2010 - Sept 14th 2010 was mostly net long by commercials
Those periods both marked the beginning of a couple months of wide range trading as stocks formed a support level and then launched into major bullish runs.

At this point, with significant negative news on the world front and the smart money loading into US stocks, it seems to me that the big move in coming months will be to the upside in stocks.

So there are several ways to play this, but at this time my suggestion is to take only the long side trades from here in US stocks.


Pete

July 31st SPY Call Exited

I sold the SPY July 31st 208 call option which I purchased for 2.50 on 7-8-15.  The stats suggested likely retest of lows and lower lows in coming weeks.  I limit exited the option for 3.25 today.  Very modest gain, but the stats were instructive and pointed to the positive skew for a short term move after the 3 month low signal.

At this point the question is whether and when to potentially act of the information in the most recent post suggesting lower lows likely coming.  Currently with prices in the gap area from 208-210, it seems like this is the first resistance test.   And with a gap up today, it may be likely that today's gap up and window is filled at a bare minimum.  There are actually a couple unfilled gap ups from last week right near the lows.

I have no further info to add at this point other than the stats from last post on the elevated total put/call ratio.


Pete

Thursday, July 9, 2015

Elevated Total Put/Call Ratio - Implications

Click on Chart to Enlarge

Yesterday the total put/call ratio spiked to 1.46 which is in the upper end of the historical range.  So looked at what this may mean for us moving forward.

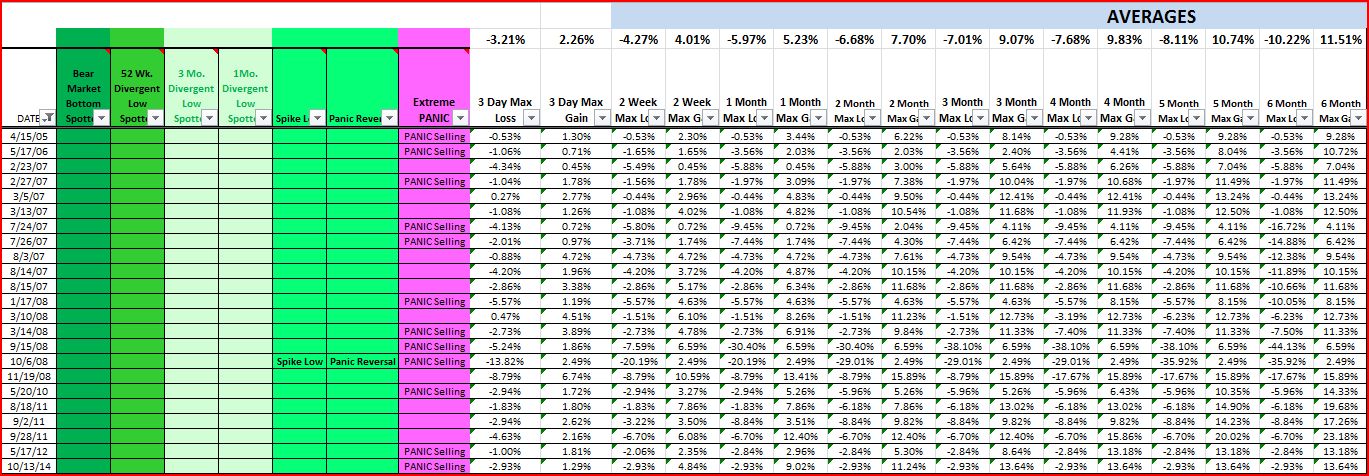
The table above shows times when the total p/c ratio was above 1.4 going back to 1995.  It also then selects only those times when the close was not greater than 0.61 of its daily range.  So basically I am filtering out day where the ratio is very elevated but prices manage to stage a close in the upper portion of the range.  This weeds out a few significant bottom reversal days which the action was obviously different than yesterday's low close.

What we see is that there is a greater max loss than max gain on average over the next month.

In just under half of the instances, all the max loss over the next month occurred within the next 3 trading days.  So that suggests that we will see likely lower lows coming relatively soon after Thursday's rally attempt.  But then there may be a more sustained rally attempt from a lower low starting point.

Since Thursday (today's) trade is gapping up significantly, we can look at times when the next 3 days did not make significant lower lows.  On the table above there are 4 out of 23 times.  And in 3 of them, the 2 week max loss is still greater than the 3 day max loss.  That suggests that of the times when the rally was immediate, prices still faltered after a brief spurt higher.  This suggests that after a couple days rally attempt here, prices may be likely to make lower lows for the move within the next 2 weeks.  That seems to me to be an ideal set-up for a near term put option purchase.

So say price rallies to 208-210 on SPY by tomorrow/Friday.  These stats suggest that more likely than not, price will continue to make lower lows over the 2 weeks relative to Wednesday's close.  In fact, out of the 23 instances above, EVERY one made a lower low.  So the set-up would be that after a brief rally here, price will move back below 204 on SPY by the week ending July 24th.  So use that info to your advantage for short term put option trades if we see a little further push higher here the next day or two.


Pete

Tuesday, July 7, 2015

Bullish Short Term Divergence at Today's Reound Attempt In SPY - Forward Results Suggest 3-10 day Rally In Store

Click on Chart to Enlarge

Today's upside reversal in SPY comes in conjunction with a pronounced bullish divergence on the hourly MACD, and pronounced bullish divergences in VIX and put/call ratios.  The stage is set for a rally attempt that could be substantial based on past instances.

The signal generated today is a "3 month low" in my bottom spotting algorithm.  Times since 1995 which have occurred in a rising bull market moving average (1 year average is up) are highlighted above.

Of note is the 2 week time frame after the signal which shows an average max gain to max loss of about 2.3:1.  11 out of 15 instances showed 2 week max gains of more than 3%.  8 out of 15 showed 2 week max gains greater than 4%.

If buying ATM options with 2 months until expiration, the max gain on the call was also about 2.3:1 versus the put.  And the average max gain was 168%.   About half the instances made max gains in excess of 150%.  So if you do the math on that, it would be a very profitable trade over time to buy the call and set a limit sell order of 150%

Since the max rate of gain here is within the 2 week time frame, it seems that buying an ATM call, and setting the 150% limit order would also be a profitable trade with pretty quick expected turnaround time.


The possibility is certainly that the market will rise rapidly to fill last week's gap down, and there may be no retest of the lows today.  However, the tail is so long on today's candlestick, that from experience, I would think that a retest of the mid point of the tail on today's candlestick is probably as or likely or more likely than not.

So my strategy here is to place a limit order of 2.50 to purchase a July 31st SPY 208 call.  The ideal would be for a choppy retest of today's low over the next couple days, followed by a surge higher to above 210 at minimum.

When the signal is filtered for a down trending 1 year moving average, the 3 day time frame shows a 2.85:1.85 max gain versus loss, still suggesting a probable 3 day potential rally.  After that, all time frames displayed greater max losses than gains for those time frames shown.

So another option here would be to simply open a near-the-money trade, and close it before Friday's close. 


Pete

Monday, July 6, 2015

SPY Bounce at 200 Day Moving Average - Probably Temporary

Click on Chart to Enlarge

Last week the SPY etf rebounded off the 200 day simple MA.  Now today it came back down and touched again.  And buying came in after the open to hold the close above the average.  Also note that the long term bull market trendline (in red) is right in the same area as the 200 day MA.

It has been a while since I discussed this phenomenon extensively so I will link to a post I made in 2011 which showed a very similar chart set-up.  You can go back through your charts and see the resultant action.

Basically what happens at key moving averages in stocks or indexes - I believe - is that there are many trading algorithms that use those averages as data points for initiating trades.  And so in this case you have price moving down, and it touches the average.  But every time it touches, the program trading kicks in and starts to initiate buying.  This is because the market is in an uptrend, and the weight of the automated trading is on the buy side.

And sometimes that buying is very strong and prices bottom right at the average.  But other times, there is no real interest.  It just chops around until the automated trading is spent, then the trend continues ( in this case down).

So one of the keys I have found is to look at the action after the moving average is touched.  If you go back to Feb 1st 2015, you will see the type of action that unfolds with strong buying followed by a gap up, and a formation of a lasting low.  So for a bullish reversal to hold, you will often see a close high in the range, followed by a gap up and a close above the open after the gap up.  Volume often will rise on these days as well.

Contrast this with the moving average tests where the reversals off the averages are weak, and the result is often several touches of the average.  This is what we are seeing here so far.  The gap ups last week were on weak volume, and each day price closed below the open.  Now we have a gap down (indicating still selling interest) and another test.  For a successful test from here, we would see a gap up tomorrow and a close above the open, and higher volume.

Even if price makes a modest rally for a few days, a deep retracement back to the average would seem to me to be a sure sign of a failed rebound attempt off this average.  The result would be a swift break below the 200 day MA.  It may lead to a big sell off in this case.

The yearly low is not too far below price on the SP500.  And given the we are past mid way in the year, a break of the yearly low, could trigger further selling in stocks.

My suggestion here is to short this market on a break of today's low with a stop above the rebound high from last week.  If price make a weak rally back towards last week's gap down, I would suggest a short there.

Now if we see a gap up and close above the open tomorrow with dominant buying interest (increased volume, close in upper portion of range) I will certainly respect the rally attempt until last week's low is broken.

Pete

Friday, July 3, 2015

Interesting Charts With Tradable Potential


Bearish set ups on BAC and EMN.

Bullish set up on NEM.  Look at the relative chart strength on this versus other gold stocks and GLD etf.

Thursday, July 2, 2015

Kiss of Death? or Buy Set Up.....

Click on Chart to Enlarge

This chart shows the total put/call average ratio has spiked above the standard deviation band suggesting that there is relative extreme fear in the market sentiment right now.  This condition typically precedes a significant market rally.  However, in major declines, the initial spike may be a good bit before the low is in.  So, I view this as a set-up on the long side, but really we need to see at least an hourly time frame MACD bullish divergence signal in order to consider the long side from a technical standpoint in my opinion.

Click on Chart to Enlarge

The is the SP 500 cash chart on a daily time frame.  Currently price is trapped below a couple rising support trend lines, but above the long term bull market trend lines coming up from the 2009 low and the Oct 2011 low.  Both the trend lines are running close together just below price.  So from a charting standpoint the market price currently seems destined to make a major move.  Either it will find some support soon and then move to new highs, or the long term trend line gets broken with some significant downside follow through. 

From a qualitative standpoint, price broke below the blue trend line of the rising wedge on Monday.  Now today price rose back to the level of the break of the trend line which is a point where I often see back tests complete before a continuation of the new trend (in this case down).  Also price broke the red trend line of a smaller wedge, and price now has back tested the line and closed below it.  This has occurred on successively lower NYSE volume as well, suggesting a probable weak counter trend rally.

In my opinion the market seems very likely to move back below this week's low before any possible low can occur to this decline.  Along this same line of thought, my bottom spotting algorithm has not registered a low signal yet after the new lows on Monday, and it is pretty sensitive at catching bottoms on declines of this magnitude.

So the conclusion from my opinion is that stocks may be close to an intermediate term buy point, but lower lows are likely still ahead on this decline.  But given the long term trend lines just below, and the non-confirmations and rising wedge chart pattern, the possibility of a major decline (at least a legit 1 month correction and roughly ~10% decline) is very real.


Pete