Showing posts with label presidential cycle. Show all posts

Tuesday, July 16, 2013

Nearing Another Possible Large Scale Pattern Completion

This post will be somewhat of a follow up to my early 2013 stock market forecast and its follow up as stocks broke out to the upside on the first trading day of January 2013.  At that time based on the market pattern I thought that a pattern could be completing and laid out in the forecast post the price action criteria that would need to be met to provide some early confirmation that the outlook was correct.  That type of price action never came and instead we saw a forceful upward move.

There is much folly I think in creating market forecasts, yet many traders and market analysts continue to do so.  I think a good market analyst is actually behaving in a scientific manner by making a forecast.  Essentially they have a theory or hypothesis of market movement and so they create an expectation based on that hypothesis.  I think that is excellent for building confidence in market analysis and trading decisions.  But the idea of objective confirming price action is a critical component as well, and if you follow any consistently good market timers or traders who make forecasts, they basically all have criteria that help to confirm the unfolding of a forecast or that quickly call a forecast into question.  This is precisely why I use price and time criteria for confirmation in conjunction with patterns.  It helps to keep somewhat patient in waiting for price to actually do what is expected, but also can still get you in early enough to make good profits.  At times I also feel that patterns can be clear enough that they give the opportunity to take calculated risk even before confirmation occurs.

Obviously since that early 2013 time we saw the bull market continue without any major corrections along the way, affirming that indeed the move up in early 2013 was a "breakout" in that it started a new price pattern and phase of market psychology to the upside.

Now at this point it appears from technical analysis and sentiment that we may be on the other side of that equation, and are nearing a possible large scale pattern completion, at least of the pattern up since Nov 2012, and possibly also of either the move up since Oct 2011 or the entire bull market since 2009.  Based on the logical concepts I use to track pattern formation, I think that it is possible we are entering the peak price area for this bull market, but it appears that the entire bull market price pattern could either end at a lower high next year or even experience a major correction, followed by another sustained bullish advance to new bull market highs into the more typical 6th or 7th year of the decade which are the most common historical topping years for bull markets.

Click on Chart to Enlarge

I do feel that I have some legs to stand on in tracking market patterns in that I highlighted in advance both the price high pattern completions at the April 2010 and May-July 2011 market highs.  See the posts below for the posts I created at those times.  In both cases I remember as I wrote them that it felt a little absurd to suggest major corrections at those times.  And in the current market environment I feel the same because the broad markets are at new all time highs yet again.

http://stockmarketalchemy.blogspot.com/2010/05/possible-major-pattern-completion-in.html

http://stockmarketalchemy.blogspot.com/2011/07/possible-completion-of-flat-pattern.html
http://stockmarketalchemy.blogspot.com/2011/07/possible-confirmation-of-new-downward.html
http://stockmarketalchemy.blogspot.com/2011/08/end-of-initial-plunge.html

-Now in order to provide confirmation that a pattern is completing what will need to see for the move up since June to now to be completely retraced in less time than it took to form.  

The red box on the chart above is the expected topping area for this rally based on pattern trend lines and time relations.  The specific date range is July 16th to August 14th.  At this time it appears likely that we could see a mild pullback followed by a push to new high or to test the highs but create a lower swing high.

As an initial stage of confirmation that a top may be in place, we would like to see the trend line of the move up since June broken.  At this point the structure looks somewhat incomplete on the short term charts, and it would be nice to see a pullback and lower high to give us a different trend line and set of swing highs and lows to work with to more specifically track the price logic here.  Basically the confirmation of a pattern completion comes when the subsequent price action completely retraces the most recent trending move in LESS TIME than it took to form.

Click on Chart to Enlarge

This is a weekly chart of the S&P 500 showing the MACD underneath.  What is very obvious from the chart is that the MACD is in the "overbought" region compared to past highs.  In fact, its recent high is the highest level it has reached going back through both this bull market AND the 2002-2007 bull market.  So we certainly are justified in being cautious here.  Now also noted on the chart on some red lines on the MACD showing divergence patterns, which are where prices makes a higher high but the MACD makes a lower high.  Weekly time frame divergences have consistently led to corrections in the last 2 bull markets. Currently as price is pushing back to new bull market highs, we have a divergence pattern setting up with the MACD at extreme overbought levels.  So we are potentially set up for a failed breakout of the May highs based on this indicator pattern.

Click on Chart to Enlarge

This is a monthly time frame chart showing labeling of a potential continually unfolding expanding triangle pattern since the 2000 highs.  That would imply that there is a coming bear market of historic proportions that would likely take price below the 2009 lows in the S&P 500.

Just for the sake of analysis, let's say we are coming to a bull market high here this summer.  Then based on the time of the last 2 bear markets we may expect the coming bear market to last about 2 years, which is about half the total time of the last 2 bear markets combined.

The red rectangle on this chart represents what I would anticipate to be the time of greatest risk of a major decline based on multiple cycle analysis that I covered in October of last year.  That time frame will be the conjunction of three potentially important cycle lows:

1) The 4 year/Presidential cycle due in Oct 2014
2) The annual cycle weakness into the Sept/Oct time frame
3) The projected low for a 7 year HIGH-HIGH-LOW sequence starting from the 2000 bull market high.

If the bull market is completing here, the chart above has some projections of what we may expect to follow.  We may see an immediate decline that is larger and faster than any in the bull market to date.  Or we may see a larger and more time consuming correction that does not retrace the most recent leg up in less time than it took to form and is not FASTER than the prior declines like the major correction in 2011.  In the second case we would be more likely to experience a rebound/retest of the old highs, which would give the classic low risk shorting opportunity and the first bear market rebound is completing.

Given the typical annual cycle weakness into the fall and strength into the spring, we may expect weakness into this fall followed by a rebound into next spring before the major downside portion of these cycles really kicks in.  Again this is all IF we are completing a bull market high in the current near term.

So let's watch as the action unfolds here.  I will also update with the typical breakout buy pattern to look for if the bull is to continue.


Sunday, October 14, 2012

LONG TERM MARKET OUTLOOK UPDATE - Larger Currents Turning Down, But Short-Term Oversold

Click on Chart to Enlarge

The monthly stochastics on the SPY is now in a bearish divergence in overbought territory suggesting a possible major high completing.  In addition to the weekly MACD bearish divergence, the stage is certainly set for a possible major correction of the bull market, or an outright bear market.  IF a bear market is beginning, then there are two distinct possibilities for future price action to logically CONFIRM that is the case.  

1.  The first would be for the entire move up since the June 2012 low to be completely retraced in less time than it took to form.  
2.  The second would be for a decline, then a rally to a lower high, followed by a move that completely retraces THAT rally in less time than it took to form.

Click on Chart to Enlarge

The weekly stochastics on SPY is now pointing down from overbought and has triggered a 1 bar trailing low sell signal on the weekly time frame.  See the recent video for further detail on that set-up.  This again suggests that we may see several more weeks of downside before the selling pressure is overdone.

Click on Chart to Enlarge

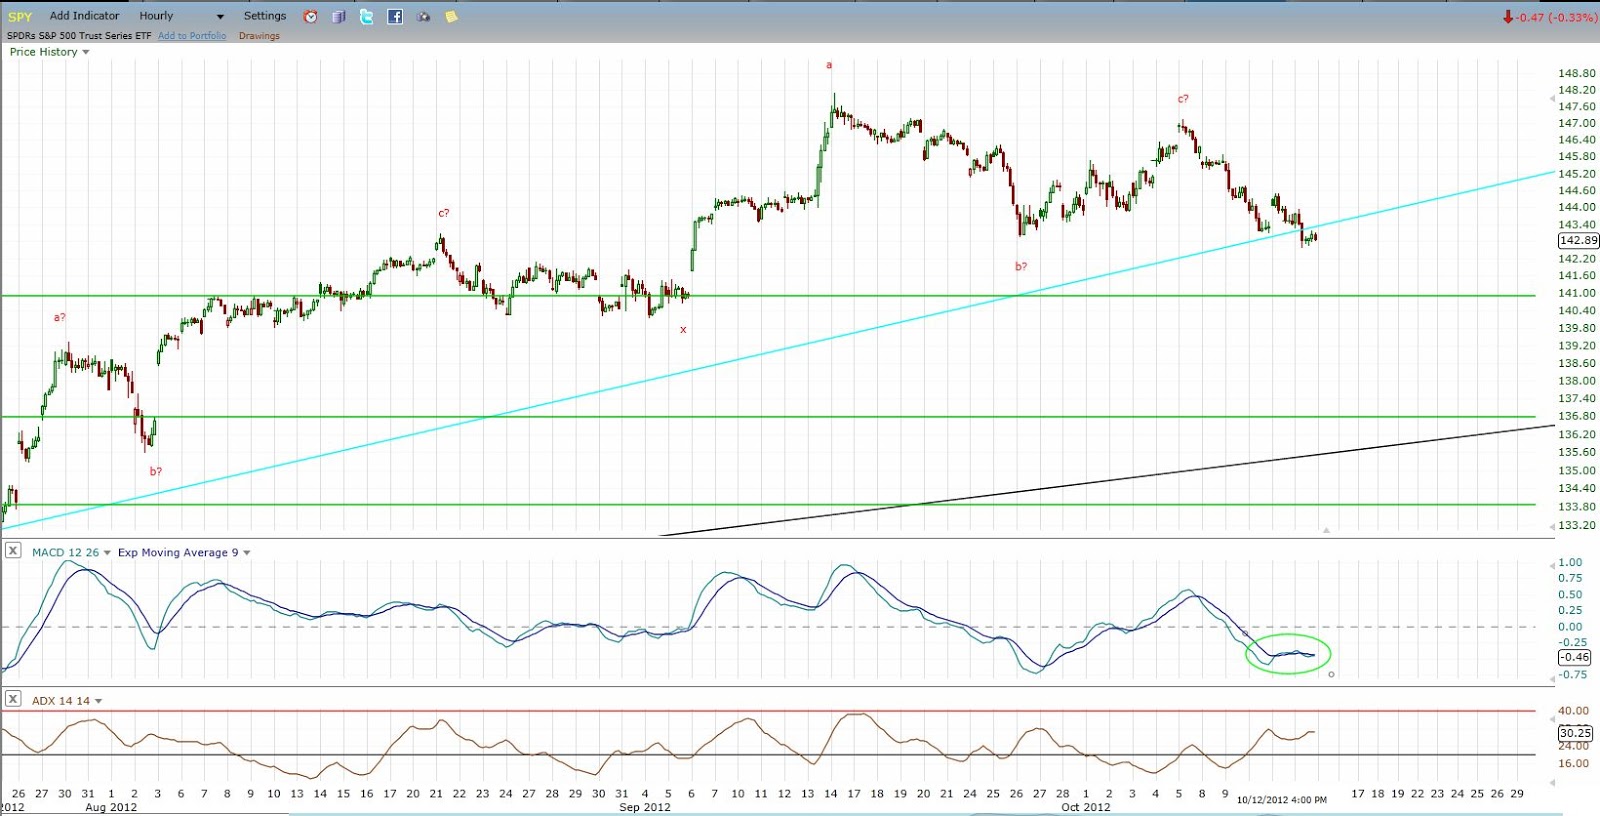
The hourly MACD chart is oversold with mild BULLish divergence at this point suggesting a short-term (multi-day) rally may be likely.  HOWEVER, with the larger currents turning down, my guess is that the rally may be dampened, and be more of a sideways chop or consolidation for a few days before a break to lower corrective lows.  Also, apparent on the hourly chart is logical confirmation of a downward pattern beginning because the recent rally was completely retraced in less time than it took to form.  It will take a move basically to new highs in 5-6 days to shift the price logic back to upwards on the daily time frame.

Click on Chart to Enlarge

A 7 legged pattern may be completing to finalize this bull market.  CoT major sell signals are noted at the major highs of the pattern along the way.  Again confirmation is needed by a move below the June lows in less time than the rally took to offer logical PROOF that the bull market is likely complete.

Of note on this chart are the red trendlines which were the prevailing uptrend lines for the bull market at the time of the intermediate highs in this bull market.  Notice that in both 2010 and 2011, the initial break was somewhat sharp but short-lived, followed by a test of the trendline from the underside before continuing down to lower lows.  In the current case, the trendline is less steep, and there is more room underneath the market before the trendline is touched or exceeded.  So, it is possible that the current decline is relatively large and sharp and does undercut the June low on the initial trendline break.  Then that may be followed by a back test of the current uptrend line before continuation downward.

Click on Chart to Enlarge

The is a quarterly chart of the Dow 30 going back to 1915.  A couple points of note here.

1.  The stochastics is overbought AT A LOWER HIGH currently, which has only happened 2 times in the 100 years seen on the chart.  Both times the market underwent substantial downside with a down/sideways market for 5-6 years before sustained upward momentum again.

2.  The dark red upper boundary line from the highs of the 1930's and 1960's highs, acted as support at the 2002 lows, then once it was breached after an initial mild rebound attempt in Sept 2008, the major "crash of 2008" occurred.  Since then, price has rallied to touch the underside of the trendline twice in 2012 both times leading to corrections.  And price is currently just underneath the line at the recent high.  So this may be a broken support that is now resistance and lead to a major correction.

3.  Notice the general "head and shoulders" top formation on the chart from 2000 to 2012 if the rally were to complete here.  The S&P 500 is similar with a triple top look.  While it would be hard to imagine the fulfillment of such a pattern on an arithmetic basis, especially given the downsloping neckline, completion of the chart-based target on a logarithmic projection would put the Dow at about 2600 several years down the road.

Click on Chart to Enlarge

This is a monthly chart of the S&P 500 going back to the 1970's.  There are a couple interesting features here.

1.  The green lines represent projections of the well know 4 year "presidential" cycle lows in stocks aligning at the 2002 and 1998 lows, then projected both forward and backward (1 is missing at the fall 1990 low).  Of note by the blue circle around the current time frame, in Oct 2012 we are exactly half way between the projected lows, suggesting we are entering the downside portion of the cycle now.

2.  The next cycle low projects to fall of 2014.  My study of this cycle suggests a tendency for the final 1/5 of the cycle (roughly) to be the most bearish portion of the cycle.  That would be from the beginning of 2014 until the projected low in this case.  So we may be topping here, but still a ways away from the worst of it if a bear market is beginning.

Click on Chart to Enlarge

Now this last chart may be the most telling, the most "beautiful" in cyclical terms, and may be one of the least know types of analysis you will hear in technical analysis circles.  See the chart for notes....but here is a summary.

-Since 2000 there is the potential for a continuing 7 year HIGH-HIGH-LOW cycle which also projects the next 7 year low in fall (October) 2014.
-There is a potential 5 year LOW-HIGH-HIGH cycle topping this month (Oct 2012), suggesting downside from here.
-There are 1/2 harmonic sub-components of both cycles present in the intervening bear and bull markets with a 3.5 year bull market from March 2009 to Sept 2012, and a 2.5 year bear market from March 2000 to Oct 2002.


I hope this post has been instructive for the larger picture going on here.  My take is decidedly bearish from this point forward in stocks for the next couple years given all the evidence presented here.


Sunday, January 3, 2010

Laying Out Major Cycles in 2010

I have touched on some of the major cycles at play in the equity markets before, but I wanted to take a bit of time to make an educated projection on when they may come into play this year.

This chart from Sentiment's Edge Blog show average yearly returns and risk/reward profiles for each year of the decade since 1928. While this is note a big enough sample size to draw much conclusions from, the basic pattern is weakness in the first few years of the decade. The year sending in "0" have a negative average return (and the worst of all ten years) and greater risk than reward on average.

Click on Chart to Enlarge

The chart above shows the S&P 500 as the top graph and a "real" inflation adjusted S&P below to more clearly highlight the dips. The chart shows the 4 year cycle in stocks, also called the Presidential cycle because it is thought to be the result of our political calendar, and there are consistent sub-cycles within each 4 year term. Note that there is a very consistent tendency for major lows to be put in place every 4 years, typically the 2nd year of every term.

Click on Chart to Enlarge

This chart adds to the end of the last chart and shows the 1998, 2002, and 2006 lows. Then the last vertical blue line is shown in the middle of 2010 this year which would be the expected time frame for the next 4 year low.

Click on Chart to Enlarge

This chart shows both an average year in the markets and an average 2nd year of a presidential term. The average year shows that most gains come from November through April and the seasonally weak time is Sept-Oct, with many years showing corrections in the autumn months.

It is not too dis-similar for the 2nd year of the presidential term but the returns are worse, with sharper and larger corrections in the fall that typically take the return negative on the year. That sharp correction in the autumn of the 2nd year of the term would be the typical 4 year cycle low.

So putting these charts together.....the 4 year cycle tells us to expect a sharp correction this year, and the 2nd year annual sub cycle suggests that it would be expected in the autumn or summer.

Now I will also say that there will be differing opinions on when a cycle bottomed, etc. Some argue that the 2006 low was not a 4 year cycle bottom, but rather that the bottom was extended to January 2008. And I have seen some suggest that the March 2009 low was a 4 year cycle bottom.

Click on Chart to Enlarge

The chart above shows several years of data with overlying 40 week cycles. This is also called the 9 month cycle. While the 4 year cycle seems to be clearly non-organic (caused by political events), it is not clear (at least to me) that the 40 week cycle is non-organic. There are different speculations to why this cycle exists, but I couldn't tell you anything definitive.

Regardless, this cycle is not something to look at rigidly, but rather that there is a tendency for significant lows to occur every 40 weeks on average. Small deviations are normal (i.e. 37 weeks or 44 weeks, etc). Also, there does appear to be a half-period harmonic of this cycle in that minor lows tend to occur at roughly 20 week intervals. There are computer programs that can filter through data and tell you whether or not there are "cycles" that occur with regularity compared to random distribution, and the 40 week cycle appears to be one for whatever reason. And beyond that, it has been recognized for some time, and is factored into the collective conscious of the markets. It often pays to stay abreast of those types of things.

Click on Chart to Enlarge

In this chart I have continued the 40 week cycle on from the previous chart. I suppose one could argue about what the dates are, but from the past history and from what I've looked at as resources, I think what I have here is the best way to look at it. This would then suggest that the next 40 week cycle bottom is due this spring, around March/April.

With the market overbought on a weekly time frame from a technical perspective, and sentiment clearly overly bullish, the idea of a turn down into this spring makes sense. Also, the positive seasonality of the Christmas/New Year time begins to wane this week.