Showing posts with label stochastics. Show all posts

Thursday, October 8, 2015

Historical Comparisons to Low VIX While Overbought In Downtrend -- Look Out Below

I ran a scan going back to Sept 1995 today which looks at a similar set-up to what is occurring now in the SPY etf relative to real money sentiment.  And this scan is totally lopsided, pointing out the tops of major bear market rallies.

The criteria were as follows:

  • 252 day EMA pointed down
  • 63 day EMA pointed down
  • 14,3 %K stochastics greater or equal to 80
  • 5 day avg. of 14 period Money flow index is greater than 50
  • VIX closes below 30
  • 5 day avg of total put/call ratio is less than 63 day average of total put/call ratio

This is what we are seeing now in our market.  Basically the moving averages are in a bear market configuration.  The daily stochastics has cycled up to the overbought region.  The money flow index is above neutral indicating the market is not in the very early stages of a rally off a bottom.  The VIX is at a low level not typically seen in the early stages of a rally from the bottom of a leg down in a bear market.  The last week of trade has shown less put activity relative to calls compared to the last quarter.  So there is sign of optimism in the options market (despite a downtrend, lower highs, etc).

Click on Table to View Past Instances

There were 5 unique instances or periods where this occurred.  All of them led to massive downside skews over the coming months as bear market leg down quickly ensued.  Not each instance here occurred right at the high of the bear market rally.  A few of the days occurred 1-2 weeks before the top of the rally occurred.  But the forward returns show a 10:1 downside skew even over the next 2 months.  

So the message here seems to be a clear red flag for any stock market bulls.  And it certainly seems like a clear signal to speculate on put options.  Entering short here with a stop 3-4% above the market also seems to be a clear strategy for the equity side.


Pete

Tuesday, September 15, 2015

SPY Multiple Time Frame Stochastics Short Set-Up


Click on Chart to Enlarge

Currently SPY has broken out of the small triangle shown in yesterday's post.  It appears set to test the 198.40 harmonic zone.

As I type, there is a developing multiple time frame stochastics set up which appears to be setting up an ideal short as price reaches this harmonic zone.


  • 5 min overbought
  • 15 min overbought
  • 30 minute overbought
  • 60 minute likely overbought later this afternoon
  • Daily nearly overbought today; possible overbought tomorrow
So if signs of bearish divergence on the 60 minute and under time frames show up without last Wednesday's high being exceeded, that seems to provide a low risk entry for a short position with a possible stop above Wednesday's high.

Even if Wednesday's high is exceeded, the multiple time frame analysis still suggests that the short term is basically overbought within a weekly time frame downtrend where stochastics has not yet become oversold.

Remember the FOMC announcement tomorrow.  This will likely bring some volatility into play tomorrow afternoon and beyond.  


Pete

Thursday, February 5, 2015

DDD Technical Analysis and Short Interest Analysis

DDD with heavy short interest
Click on Chart to Enlarge

This chart is a daily chart of DDD.  I bought a May 29 strike call on it yesterday.

The technical position of the stock is compelling for a rally here in my opinion.  Price has under cut a low from March 2013 (not visible on this chart) and reversed higher here.  Stochastics is showing a weekly and daily bullish divergence on the low Tuesday in conjunction with a very high volume gap down and under cut of the January lows only to reverse and close in the upper end of the range and above the January lows.  This has the appearance of a failed break of support which often provides a high quality long entry.

There is money flow index bullish divergence on the recent leg down, indicating that the downtrend is running out of steam.

The stock is heavily shorted with 33% of the float short as of 1/15/15.  The short interest ratio is 12.5 which is rather high and indicates plenty of short covering potential on a rally.  While I don't have detailed data on the underlying short squeeze trigger price, I am estimating that a rise to the $35-38 level will likely cause some short covering based on the short interest increase from October to December.

Another factor here is that earnings comes out 2/26/15 before the market opens.  Given the oversold technical position of the stock with bullish divergence, I would give better than even odds to a bullish response during this earnings period.

Pete


Thursday, August 14, 2014

FL Dual Time Frame Put Option Set-Up

Click on Chart to Enlarge

This is a daily chart of FL, Foot Locker.  Notice the daily stochastics in the overbought position at a lower high and the more time consuming and overlapping rally off the 7-17-14 low, in comparison to the prior decline off the high.  This creates a nice price logic set-up for a short sale or put option trade.  Now let's move down to an hourly chart to focus in on a trade entry for the set-up

Click on Chart to Enlarge

This hourly chart shows a recent momentum peak at the upper end of the recent range of the momentum indicator.  Now we are seeing price to push to higher highs, but the momentum indicator is reaching a lower peak.  The indicates a slowing down of the current action, with the distinct possibility the price will soon reverse to the downside.  So from this point, on a trading basis, an objective method is needed to enter, or simply enter during the divergence and place a stop above the resistance level which would be the highest point on the chart.

HOWEVER, the earnings release is next week, and so the potential exists for a significant gap or price movement.  So in this situation my reasoning is that making a trade just before earnings is essentially a gamble, and if the earnings moves the stock up rather than down as the technical analysis suggests to me here, then I basically have a coin flip in risk versus reward by shorting the stock.

But in terms of options, if price moves up and no significant decline materializes, the max loss is 100% of the option value, but if earnings comes out with a gap down and break of the recent July support, the option could very reasonably move 200-300% or even more over the next couple weeks.  So in this situation I am electing to try to purchase a put option as prices hit this resistance area, with the reasonable probability of a 3:1 reward versus risk on a Sept 50 put option.

I currently have an order to buy the put at a limit of 1.40.  The spread is about 0.20 on the option, and it appears that price would have to move another 20-30 cents up before the order would fill.

Please note that this is for education, and that you will lose 100% of the money in this trade if the trade is not successful.

Friday, June 20, 2014

Stochastics Dual Time Frame Sell Set Up


Stock Market Analysis 6-18-14
Stochastics Dual Time Frame Sell Set Up

This stock market video covers multiple time frame analysis of stocks with specific focus on IWM.  There is a multiple time frame stochastics sell set up and a possible head and shoulders top formation happening in IWM concurrent with some extreme market sentiment measures.

I also review gold, oil, bonds and a few sentiment measures regarding US stocks.

Monday, April 22, 2013

SPY Technical Analysis

Click on Chart to Enlarge

This is an hourly chart of SPY which is the S&P 500 ETF.  The daily chart is not shown but has triggered a parabolic SAR sell signal, so price is below the SAR point.  Also not shown is the weekly chart which also triggered the SAR sell signal last week, so price could be considered to now be in a downtrend on those larger time frames.  Of note on this chart though, we can see that price is above the SAR point on the hourly chart and has some room below it before triggering.

So here is my take away from the multiple time frame set up.  When you see a stock or market trending in one direction on the larger time frames, you can then use your indicator set-ups and triggers on smaller time frames to trade in the direction of the larger trend.  So in this case, for a short sell swing trade on SPY, I would suggest waiting for the hourly SAR to trigger, and if it does so AT A LOWER HIGH than the recent all time high, then that could be a nice short entry.  Also, possible is that the first SAR sell signal fails and leads to a higher price high and possibly some technical divergence.  In that case, then we could again take the next SAR sell signal to trigger.

Similar comments could apply for the MACD indicator set up.  The daily is down and coming off a sharp bearish divergence.   The weekly is flat.  The hourly is up, and if the hourly MACD turns into a sell at a lower high than the recent all time high, then it could offer an opportunity to short.

We will want to pay attention to whether this move up is able to retrace the recent decline in less time than it took to form or not.  That will help us objectively gauge the direction of trend strength in the market.

Currently the 153.60 level on SPY has been tested 3 times and held.  If prices move below that level, it could offer a continuation entry for additional downside, and be probable confirmation that we are in a correction.  The daily bollinger band is currently at that level as well, and prices rebounded after touching the lower band.  That is to be expected in an uptrend.  And in the initial move down off of a high, it often will occur as well.  But if prices break below that low again, then it indicates weakness and will probably lead to downside follow through in my opinion.


Sunday, October 14, 2012

LONG TERM MARKET OUTLOOK UPDATE - Larger Currents Turning Down, But Short-Term Oversold

Click on Chart to Enlarge

The monthly stochastics on the SPY is now in a bearish divergence in overbought territory suggesting a possible major high completing.  In addition to the weekly MACD bearish divergence, the stage is certainly set for a possible major correction of the bull market, or an outright bear market.  IF a bear market is beginning, then there are two distinct possibilities for future price action to logically CONFIRM that is the case.  

1.  The first would be for the entire move up since the June 2012 low to be completely retraced in less time than it took to form.  
2.  The second would be for a decline, then a rally to a lower high, followed by a move that completely retraces THAT rally in less time than it took to form.

Click on Chart to Enlarge

The weekly stochastics on SPY is now pointing down from overbought and has triggered a 1 bar trailing low sell signal on the weekly time frame.  See the recent video for further detail on that set-up.  This again suggests that we may see several more weeks of downside before the selling pressure is overdone.

Click on Chart to Enlarge

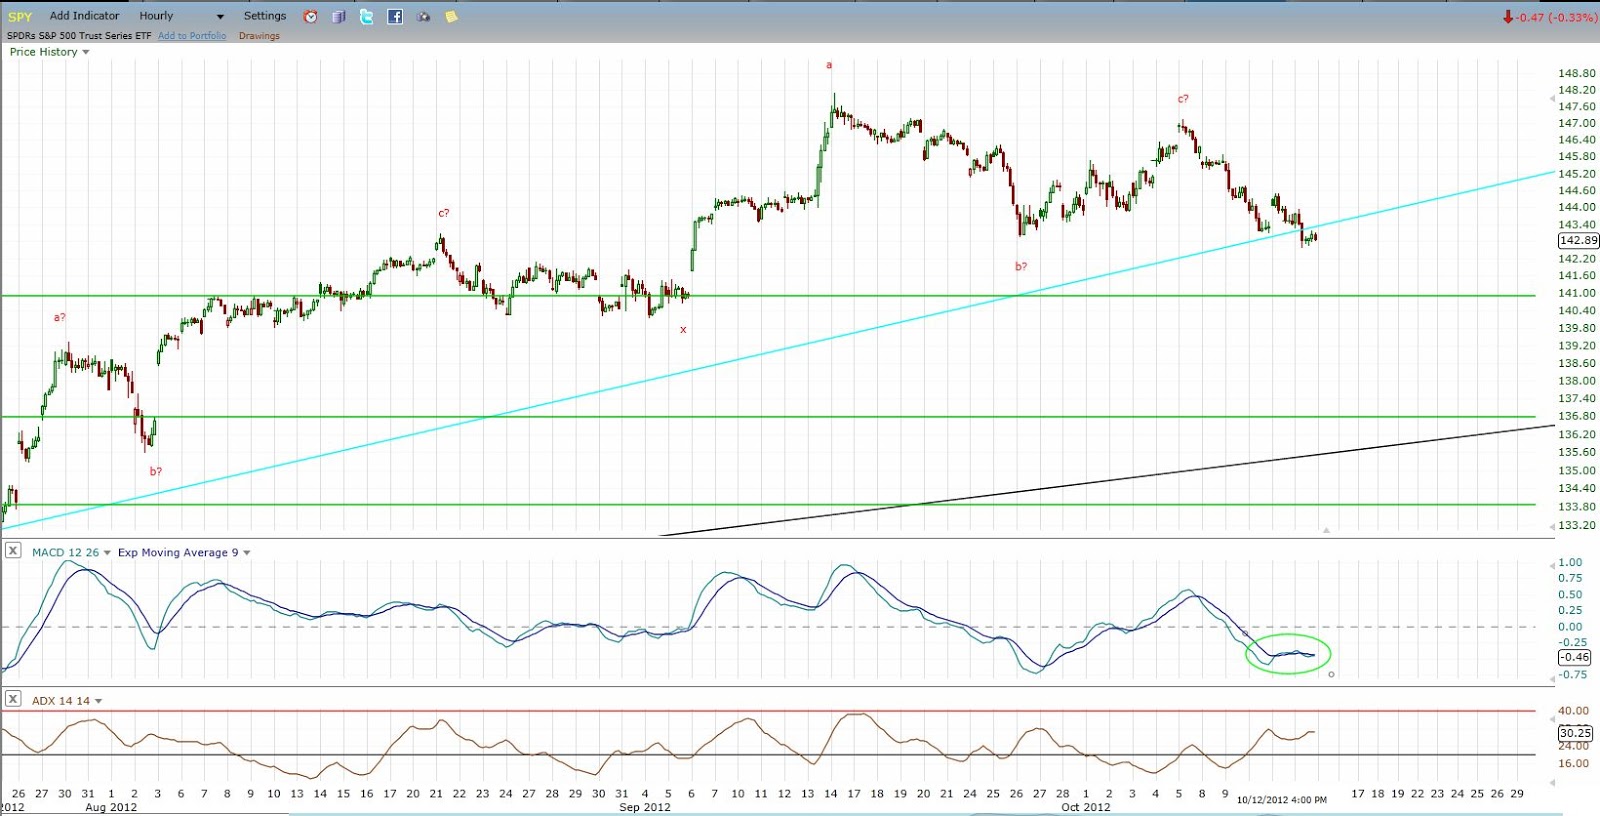
The hourly MACD chart is oversold with mild BULLish divergence at this point suggesting a short-term (multi-day) rally may be likely.  HOWEVER, with the larger currents turning down, my guess is that the rally may be dampened, and be more of a sideways chop or consolidation for a few days before a break to lower corrective lows.  Also, apparent on the hourly chart is logical confirmation of a downward pattern beginning because the recent rally was completely retraced in less time than it took to form.  It will take a move basically to new highs in 5-6 days to shift the price logic back to upwards on the daily time frame.

Click on Chart to Enlarge

A 7 legged pattern may be completing to finalize this bull market.  CoT major sell signals are noted at the major highs of the pattern along the way.  Again confirmation is needed by a move below the June lows in less time than the rally took to offer logical PROOF that the bull market is likely complete.

Of note on this chart are the red trendlines which were the prevailing uptrend lines for the bull market at the time of the intermediate highs in this bull market.  Notice that in both 2010 and 2011, the initial break was somewhat sharp but short-lived, followed by a test of the trendline from the underside before continuing down to lower lows.  In the current case, the trendline is less steep, and there is more room underneath the market before the trendline is touched or exceeded.  So, it is possible that the current decline is relatively large and sharp and does undercut the June low on the initial trendline break.  Then that may be followed by a back test of the current uptrend line before continuation downward.

Click on Chart to Enlarge

The is a quarterly chart of the Dow 30 going back to 1915.  A couple points of note here.

1.  The stochastics is overbought AT A LOWER HIGH currently, which has only happened 2 times in the 100 years seen on the chart.  Both times the market underwent substantial downside with a down/sideways market for 5-6 years before sustained upward momentum again.

2.  The dark red upper boundary line from the highs of the 1930's and 1960's highs, acted as support at the 2002 lows, then once it was breached after an initial mild rebound attempt in Sept 2008, the major "crash of 2008" occurred.  Since then, price has rallied to touch the underside of the trendline twice in 2012 both times leading to corrections.  And price is currently just underneath the line at the recent high.  So this may be a broken support that is now resistance and lead to a major correction.

3.  Notice the general "head and shoulders" top formation on the chart from 2000 to 2012 if the rally were to complete here.  The S&P 500 is similar with a triple top look.  While it would be hard to imagine the fulfillment of such a pattern on an arithmetic basis, especially given the downsloping neckline, completion of the chart-based target on a logarithmic projection would put the Dow at about 2600 several years down the road.

Click on Chart to Enlarge

This is a monthly chart of the S&P 500 going back to the 1970's.  There are a couple interesting features here.

1.  The green lines represent projections of the well know 4 year "presidential" cycle lows in stocks aligning at the 2002 and 1998 lows, then projected both forward and backward (1 is missing at the fall 1990 low).  Of note by the blue circle around the current time frame, in Oct 2012 we are exactly half way between the projected lows, suggesting we are entering the downside portion of the cycle now.

2.  The next cycle low projects to fall of 2014.  My study of this cycle suggests a tendency for the final 1/5 of the cycle (roughly) to be the most bearish portion of the cycle.  That would be from the beginning of 2014 until the projected low in this case.  So we may be topping here, but still a ways away from the worst of it if a bear market is beginning.

Click on Chart to Enlarge

Now this last chart may be the most telling, the most "beautiful" in cyclical terms, and may be one of the least know types of analysis you will hear in technical analysis circles.  See the chart for notes....but here is a summary.

-Since 2000 there is the potential for a continuing 7 year HIGH-HIGH-LOW cycle which also projects the next 7 year low in fall (October) 2014.
-There is a potential 5 year LOW-HIGH-HIGH cycle topping this month (Oct 2012), suggesting downside from here.
-There are 1/2 harmonic sub-components of both cycles present in the intervening bear and bull markets with a 3.5 year bull market from March 2009 to Sept 2012, and a 2.5 year bear market from March 2000 to Oct 2002.


I hope this post has been instructive for the larger picture going on here.  My take is decidedly bearish from this point forward in stocks for the next couple years given all the evidence presented here.


Wednesday, September 26, 2012

Nearing Confirmation of A Correction- But Short-Term Oversold

Click on Chart to Enlarge

This is a 60 min chart of SPY.  The MACD is oversold indicating the market may attempt a rally.  It would be better to see a bullish divergence develop before considering a new long entry.

Given the momentum set-up with the weekly and monthly stochastics overbought and the weekly now in a sell signal formation, I think the better opportunity is to wait for the likely rally and then look to short/inverse on the next sell signal if price meets resistance at or below the recent highs of 9/14/12.

Click on Chart to Enlarge

The spread between the smart money commercial futures traders and the large speculators is at a 3 year low indicating the smart money is heavily short with a bearish outlook for prices.  The last times the spread was this large were June 2009 before a 4 week correction, around New Year's 2009 before the final plunge into the 2009 bear market low, and the first week of Oct 2008 before "the crash" plunge into the Oct 10th low.  The time before that was late February 2007 just before a surprise 4% plunge day in the markets and an 8% overall correction.

The point being that there is no other real interpretation of this than at least a modestly bearish one.

The correction off the recent high in the SPY etf is now 8 days long.  The prior longest correction since the June low was 9 days.  If the decline continues to 1415 on the S&P 500 cash, the decline will be larger than any other pullback since the June low as well.  So further downside would create an overbalancing of both price and time suggesting a correction of at least the June-Sept leg up is occurring.

Of note is that open interest rose sharply in the last reporting period with an increase in the commercial net short position.  This indicates that there is NEW hedging or commercial short interest coming in at these level.  While this may seem trivial, another pattern which occurs is for commercials to go heavily short, and then cover their shorts on falling open interest as the market pushes higher and puts them at a loss.  That pattern tends to lead to a sustainable price advance.  We are NOT seeing that right now, which indicates that we may be making a very important high here.

Again my suggestion is to exit longs and growth stocks, or trail stops tightly.


Thursday, June 21, 2012

Rebound Likely Complete

Click on Chart to Enlarge

The daily chart on the Russell 2000 shows a possible completed upwards abc pattern that has retraced 50% of the April-June decline.  This looks very nice from a traditional Elliott Wave perspective, and potentially sets up a wave 3 or C down that has just begun.  This would imply a major decline over the coming weeks.  Notice the daily stochastics has crossed down from overbought territory marking a potential short entry signal with a stop above this week's high.  The only problem at this point is that the hourly stochastics is oversold as of the close.  It would be ideal to see it recycle back up to overbought after a mild consolidation into next week before a short entry.  Those ideal set-ups don't always come, and given the wave pattern, the risk to reward is still solid using just the daily chart signal.
 
Click on Chart to Enlarge

This chart shows that break of the rising wedge type formation I had noted.  This is a different system of pattern labeling based off of price logic.  Again this would imply either a large continuation down, or a couple days rebound after last week's lows are taken out, and then a likely major price break down.

In any case, I had expected a 2-4 week rebound and we are on week 3 this week.  The daily chart price touched the upper bollinger band as well.  So this would be a nearly ideal time for a top to occur, though some further upside to next week would be nice as well if it created some stronger technical divergence.

Monday, May 21, 2012

Stock Market Update

Click on Chart to Enlarge

Today was a nice reaction rally from oversold conditions in the stock indexes.  However, the volume was a lot lower than Friday and sharp rallies like this should be expected in a downtrend, especially given the high put/call ratios recently. 

I have made a couple projections for the SPY from this level.  The blue projections would be a more dramatic but certainly not impossible waterfall decline that would be typical of a MAJOR pattern completion in the markets.  If this spring's high was the end of the bull market rally since 2009, then we should expect a larger move than any correction along the way.  So we could see a decline bigger than last summer's decline.  Obviously that seems improbable, but that would confirm a new bear market.

The green projection is what would be a very typical type of scenario before a new decline.  I have not talked about this recently but often the first support level is broken followed by an ABC type rally that retraces about 50% of the initial thrust down.  That is followed by downtrend continuation.  Should we see that scenario play out and the market remain well below this year's highs as the time of the purple box reaches its end in the first week of June, and the daily stochastics has rallied back up to overbought and then turns into a sell signal, that would be a time to short crap out of it.

The elevated put/call ratio typically leads to a multi week rally, so we may expect a more bullish near term scenario, but any push to new lows, will likely initiate a dramatic plunge lower.