Thursday, January 29, 2015

Elevated 5 Day Total Put/Call Ratio - Bullish Implications in an Uptrend

total put/call ratio
Click on Chart to Enlarge

This chart sorts all the days where the closing 5 day simple average of the total put/call ratio was greater than or equal to 1.11 which is the current level.  Notice that the average may stay above that level for several days in a row as a market is down trending.

But some points of notice are that the average 2 month future maximum return was about 1.5 as great as the 2 month max decline since 2012, a period where the market has clearly been up trending.

Also, I have constructed an option pricing model which gives a theoretical maximum gain on an ATM call or put option over the next 2 months.  They are represented by the green and light red columns.  It indicates that over the next 2 months we may expect the call option to gain in excess of 100% while the maximum gain in the put may be limited to 25-30%.  Additionally the way I constructed the model it appears that almost none of the puts were still in a profit after 6 or 7 weeks from the signal day.

So, while there are interesting cross currents here and my timing on yesterday's call option purchase was not great right before the FOMC announcement sell off, from a purely historical basis, it appears that the reward to risk appears skewed to the long side in coming weeks.

A factor that would significantly improve the skew to the long side would be a reversal day where price makes a lower low for the decline but price then closes up for the day and/or where price closes above the midpoint of the daily range.

So if you are not long here or in call options on the US indexes it may be sensible to have it on your radar for a speculative play and enter on an appropriate shorter term chart buy signal (like a 30 or 60 min chart).  I would be looking at ATM or ITM call options with expirations of March (end of month) or later.

Pete

Wednesday, January 28, 2015

SPY About to Break Out of a Triangle Pattern - Probably to the Upside

Triangle ready to breakout in stocks
Click on Chart to Enlarge

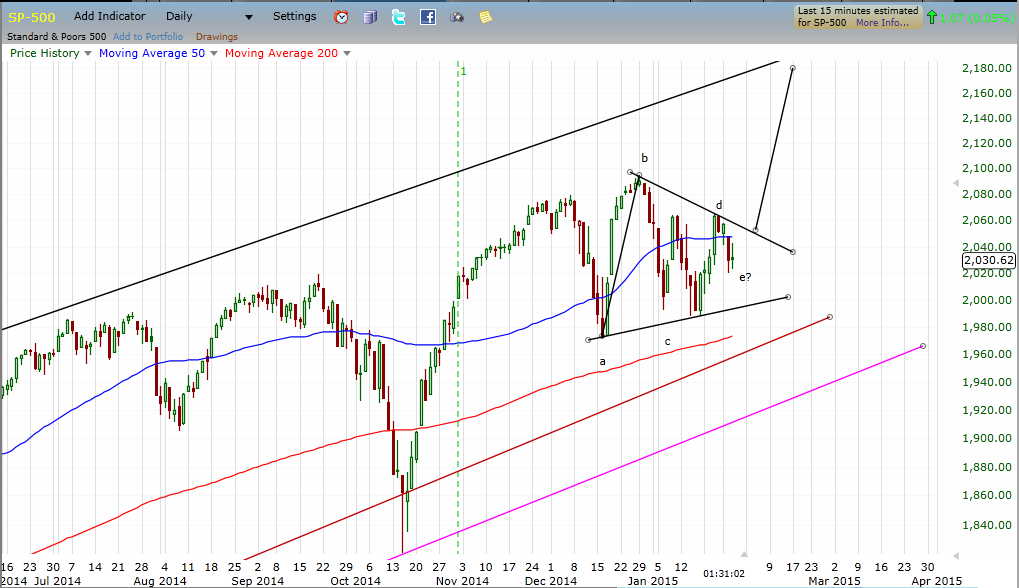
This chart is the cash SP 500 index daily chart.  It appears to me that a counter trend (trend is UP) triangle pattern is forming  since  the December highs.  In any case it is objective that there is a contracting pattern at play as evidenced by the two trend lines formed from the points a,b,c,d on the chart above.  The normal and expected resolution would be for a breakout in the direction of the prior trend.

At the current point, price has pulled back into the apex area of the triangle offering a potential low risk buy point with a stop below point c.  If extending the trend lines to the apex and taking the start point as the December highs, the current point is nearly 2/3 of the way to the apex of the triangle in terms of time.  Most triangle don't stay range bound much beyond that, so my expectation here is that a breakout will soon occur.

Additionally on a short term basis, the price logic favors upside strength until proven otherwise.  Notice that the move up from the Jan 16th minor bottom took 4 days, and now in the subsequent 4 days, there has only been about a 50% retracement of the prior 4 days gain.  This indicates on a logical basis that the psychological short-term pattern trend of the market is UP.  Trends are by definition the direction of the larger moves, and they also often have a higher rate of gain.  So a larger and faster move followed by a slower and smaller move is the norm for a trend.  In this case I would place the odds of future upside strength to be well above sustained downside strength.

It appears most likely to me that an upside breakout will coincide with a broad based strengthening in commodities and a major pop higher in the price of energy shares which have been pummelled recently.  Additionally, given the intermarket correlations, I would anticipate a weakening in US bond prices and a corresponding move higher in yields if this scenario plays out.

From a long term cycle standpoint, the most common time frame for bull markets in US stocks to peak has been the 6th or 7th year of the decade.  And the 5th year of the decade is invariably a positive year in the history of our stock market.  These factors would provide some historical argument for expecting the resolution to be to the upside here as well.

On a shorter-term seasonal basis, the mid-October through April time frame has historically been the most bullish in US stocks for whatever reason.  So that is another factor here that would suggest having a long side bias for the coming breakout with a probable trend continuation up into the spring of this year.

A breakout to the upside would have a target from 214.00 to 218.00 on SPY if measured up from the apex of the triangle or from the likely breakout point in my estimation.

I have purchased an April 203 call option on SPY for 5.50 in anticipation of such a move beginning soon.  I will update as to future trade management on this option.

Pete

Monday, January 26, 2015

What to Expect From Here in Oil Prices


I have made several posts recently regarding oil and energy prices and some individual stocks in those industries.  The reason for this is the extreme position of crude oil and the potential profit that can be made on a turn up in oil.  It is not every day or week or month or year that major markets experience the type of dramatic re-valuation in prices.

Based upon history we know that the greater the bear market, the greater percentage gains we expect to make in bull markets, and the more violent the initial thrusts off the low tend to be.  So I am personally looking to catch a shorter term thrust up in the coming days or weeks.  Then my expectation is that we are likely to see a major bottom or bear market low occur within the next couple months.

I have gone back through the history of crude oil prices and made some observation regarding major bottoming processes.  Here is a quick summary of what I believe is important:


  • The winter (Nov-February) has seen some of the most significant bottoms in history
  • There was often a violent rally lasting a week or a few weeks off of the momentum low (low in indicators) which was followed by a modest break to a new final low within 1-2 months later
Given the current position of oil prices is believe we are very near the beginning of the expected violent rally off the momentum low.  Then I would anticipate a retest and or break to new lows over the next several weeks, with February or March being the expected months to bottom.

I have also suggested that looking at energy equities that are not confirming moves to new lows in oil may be the best speculative opportunities at this point.

I recently posted about CHK and it continues to look like it is just resting below a short-covering breakout point which may produce very nice short term burst higher if oil does indeed strengthen even for a week or two.

If you have questions about how to navigate oil and related issues currently, reply or comment and I will try to assist you.


Thursday, January 22, 2015

SLV Option Update Heading Into Jan 2015 Expiration

As a follow up again to the current call options I am holding in SLV, I have Jan 30 expiration $17 strike calls.  They were purchased for 0.13 per contract on 12/19/14.

I just exited about half of those contracts for 0.71 which is about 440% gain.  I am holding the other half with a limit order to exit at 1.43 currently.

Currently the hourly charts of SLV are demonstrating loss on momentum and some divergence.  And given the fact that SLV is not too far from the 17 strike, it would be a shame to hold the whole position and see a pullback into next week basically take at 400% gain down to nothing.  So by exiting here I have guaranteed a profit on the whole position, and am awaiting my limit order to hit or expiration to come at the end of next week.

I made a post here linking to a TradingView post I made about SLV noting that it may be set for a vertical rally.

I exited the other Jan $15 strike calls on expiration day for about 150% gain.  They were purchased for 0.75 per contract on 11/13/14.

I am just posting this here because for the individual trader, without automated trading decisions, it is times like these that will make or break the profit.  So hopefully by thinking through a scenario like this you can improve your own trade management ability and plan contingencies.

Pete


Wednesday, January 21, 2015

Stock Market Update

Based on my most recent post mentioning US stocks and the elevated VIX/VXV ratio, the 1-16-15 reversal was a potentially significant bottom reversal.  Given the overall bullish trend, it would make sense to be long with a stop below the Jan 16th low.  However, given the position of elevated volatility and a multiday attempted rally so far, a break below the Jan 16th low may lead to significant continuation to the downside.

Click on Chart to Enlarge

This chart of QQQ has the general appearance of a descending triangle, which most often is a bearish chart pattern, but not confirmed until a close below the lower boundary line.

There is a downward tilt to the pattern that makes it possibly a falling wedge, which is typically a bullish pattern in an uptrend.  So the key here from a charting perspective is whether the top boundary or bottom boundary trendline is broken on a closing basis.  The assumption at that point will be that the trend will continue towards the next support or resistance area.  In this case that would be the all time highs as resistance, and the October lows as support.

Pete

Tuesday, January 20, 2015

Why I Expect Oil to Rally When Everyone is Bearish

crude oil commitment of traders
Click on Chart to Enlarge

This is a chart of crude oil with Commitment of Traders positions below the price chart.  I wanted to give a little more detail on my perspective on the energy complex.

Of note on the large speculators positions, they have gotten progressively more short until early December which is their normal pattern.  They are the money that drives speculative trends.  Interestingly however, as price began to accelerate down ever faster at the beginning of December, the large specs have not increased the short position.  At this point there is a bullish divergence in the positions.  So crude oil has fallen 33% without the large specs increasing their short position.  This type of divergence is pretty classic as a trend ending pattern in underlying positions.

For basic understanding, first realize that the money that drives trends comes from somewhere.  And when the biggest money that there is, which drives the price trends, no longer follows the trend, the implication is that they do not have any more fund capacity collectively to participate in or push that trend.

So we have certainly ample evidence of that with a multi week massive decline but no further shorting by the large specs.  Additionally, there is now in the last few weeks at least a modest return to the normal commercial/smart money pattern of buying as prices decline.  So that indicates to me that the very directional commercial capitulation stage of this decline is likely waning.

Additionally, the daily MACD is demonstrating bullish divergence, and the money flow index is demonstrating pretty classic reversal divergence.  The money flow index basically looks at price and volume and typically demonstrates a substantial lead time with prices.

Taken together, it appears to me that energy prices (including natural gas, heating oil, gasoline) are likely to stage a rally very soon.  Whether or not it will be a bear market rally I don't know.  I would lean towards believing that because of no weekly time frame MACD divergence currently at these lows.  I think it will more likely turn into a volatile basing period or a rally followed by a failed breakdown to new lows before prices may bottom longer term.  But that is looking out kind of far for my purposes.  Really I am just interested in catching the next swing up, which I expect to be quite swift given the major oversold condition of this market.

XLE bullish divergence
Click on Chart to Enlarge

For those more interested in equities, this is XLE which is a major ETF covering oil and energy related stocks.  Notice how it has not maintained the aggressive decline that oil has.  And it also is displaying a drawn out bullish divergence on the MACD with a more classic chart pattern bottom with a failed breakout below the December 16th low, followed by an immediate reversal higher.  This indicates a stop running move in the market and that the buying interest was picking up right at that low as other (dumb money) was selling out or shorting in the break.  This makes the dumb money about as wrong as possible and the smart money about as right as possible.

For trading purposes the XLE etf may be a better purchase or near term speculation than crude oil itself.  That remains to be seen, but just understand there are several ways to participate in this probable reversal.

Sunday, January 18, 2015

OAS Call Option and Short Interest Analysis

Click on Chart to Enlarge

This daily chart is of OAS which is Oasis Petroleum, an oil correlated equity.  I have a order to purchase the February 15 strike call option.

According to data on Schaeffer's Research, there has been a near doubling in the amount of shares sold short from the Dec 1 to the Jan 1 reporting period.  As of the current data, there is over 24% of the float sold short.  This is obviously an indication of pessimism on the stock, which seems justifiable (and profitable over the last several months).  Nevertheless it does create a large potential supply of buying power in this stock if prices rally and put the shorts at a loss.

A bit of my logic on this is indicated on the chart above.  The light blue moving average is the simple average price since December 1st at which point 8.61 million shares were sold short.  As of January 1st 16.91 million shares were sold short.  So basically we have seen a huge increase in the number of shares shorted since December 1st.  And I don't know exactly were they were shorted, but just using the average price and assuming they were relatively evenly shorted during that period, then that would put the average price shorted at about 15.00 (or maybe 15.90 if using the high of each bar for the average).  So if prices rise above the 15.00 level, that would possibly put the average short position at a paper loss at that time.  And then any further rise will put those newly shorted shares at an even further loss, creating pressure to cover the position.  Covering is done by buying the shares, and so that would be significant buying interest forced into the stock.

Additionally, price this week did not even come close to making a new low for the decline despite oil's new low.  This again is a non-confirmation with the commodity that may be a sign of bottoming in the sector and relative future strength in this stock.  Furthermore, a move above the December 23rd high would be a stop loss point on the chart, and again, given the hefty short interest, may lead to a short covering burst of buying.  There is a large heavy volume unfilled gap down above that at 25.24.  If oil is bottoming here and going to stage even a bear market rally, that $25 level would be a likely target for OAS in my opinion for the coming weeks.

So my plan here is to buy the call with the expectation that we may see prices rally in the next 5 weeks and make a significant gain in the option.  If buying, a simple strategy could be to enter a limit order to sell half the position at 100% or 1/3 at 200% gain and then hold the rest assuming prices appear to be moving higher.  Then a more finely tuned final exit can be sought.

But the set-up here looks good for an equity purchase as well with the same overall trade logic.

If there are any follow up questions to this analysis or oil related issues, reply here and I will try to assist you.  I view this oversold oil sector and the XLE etf as a prime opportunity for profit at the current time.


Pete


Friday, January 16, 2015

CHK Option Trade

Click on Chart to Enlarge

I purchased a call option position on CHK today for 2.48 April 18 strike call.

CHK is an energy related stock, which is in the oil industry which obviously has been hammered down in price recently.

However, there are some signs that the oil downtrend may be near exhaustion, and that CHK may be one of the sector that is showing relative strength on the charts.

Notice that oil has been making new lows into this week.  However, CHK bottomed with a double bottom reversal on 12/12/14.  Now on oils push to new lows, CHK has held well above the the 12/12/14 low.  This creates a non-confirmation with the underlying commodity and is a sign that CHK is basing and ready for a move higher.

A subtle note on short interest is that during this downtrend, the short interest has consistently risen as CHK has rallied and then declined as price declined.  The same pattern did happen again as price rallied in CHK into late December.  HOWEVER, now that price has declined but did not make a new low, and there is the real possibility of a break above the December highs if oil strengthens, then it seems likely to me that there would be some short covering forced on a break of that price peak around 20.40 on CHK.

For stocks one could be long with a stop below this week's low, and then exit at a limit of 23.04, which is the fill of a large gap down.  That would be a solid reward/risk play, and one with a clear logic behind it.  I am in the call option with plenty of time for a significant move and, in my estimation, a very good probability that this option will at least double in price at some time prior to expiration.  The key will be to make a timely exit or scale out if prices do rise.


Let me know if there are other oil related issue that you would like looked at.

Pete

Thursday, January 15, 2015

VIX/VXV Above 1.0 - We Will Either See a Bottom or a Swift Sell Off

Yesterday the VIX/VXV ratio closed above 1.0 again.  I have highlighted this many times on this blog and you can search for that term on my blog to find prior posts and info on VIX/VXV and its significance.

Basically the market is at a state or near term heightened volatility.  There is an increase in "fear" or substantial near term volatility priced into the options market.  There are two outcomes that basically always occur after these signals.


  1. A significant bottom is quickly formed which often leads to a substantial rally and an important lasting low occurring in prices.  Often times from the first VIX/VXV close above 1.0 to the low of the correction is just a matter of a day or a few days.
  2. There will be an increased near term volatility with even greater % price losses than have yet been seen in the current correction.  

In either case, price may be near a low in terms of time.  But in the second case there may be a very significant downward price move prior to the low.

My personal perspective here is that with yesterday's VIX/VXV ratio above 1.0 concurrent with a price reversal in the session, a break of yesterday's low would basically be a "failure" of a bottom attempt and would be a sign of significant caution for bulls.  I would advise that if Wednesday's low is broken, a trader either be flat and awaiting another price reversal bar at a new corrective low, OR be short with a stop no higher than above the Jan 9th high.

If prices do continue lower from here I will be likely be more active in posting here in order to help you pinpoint upcoming market turns as they develop.

That being said, unless Wednesday's low is broken, yesterday was a bullish signal in the markets.


Pete

Tuesday, January 13, 2015

Silver Update

Recently I had mentioned that silver may be set for a directional advance.  So far that call has held up well with silver up over 7% in the 2 weeks since that post.

Sow silver is at resistance from the early December high and is at a potential continuation or breakout failure point.  My personal opinion here based on the technical analysis is that the breakout will succeed and price will continue to advance in the coming weeks or few months.

While I didn't give a specific trade entry or price, if you took that information and got into silver or are holding silver, and if you would like any input on specific scenarios depending on which option contracts were purchased or where and when stops can be moved on equities or futures, then either comment or email reply to this post and I will try to assist you or create a follow up post.

As a personal note I do have 15 strike SLV options that expire at the end of this week.  They have seen some volatility during my holding period by are currently up right around 100%.  So I will be vigilant here about watching a potential breakout for deciding whether to hold until the end of the week, or exiting out sooner.

Also I do have some options that expire at the end of January which are 17 strike SLV calls.  So they are out of the money, but I got them at 0.13 per contract and they are up about 50% currently.  However, time decay erodes them every day here, and so it will take a continued move higher for them to really be the winner I hoped for.  Based on some projections I felt that SLV may rally into the $18-19.50 range by the end of the month.  That would make for a nice potential gain.  Given the significant OTM position at entry, it is a small position that can afford to lose all of its value.  But it has the potential for a big % gain, and so I am planning on holding until expiration or until the weekly %K stochastics goes above 80 at which point I will immediately exit the position.  That only gives me 2.5 weeks for that to happen, but it is still possible if moving above the December high creates some short covering or new significant buying.  That scenario could easily boost silver 10% or more in just a couple days.

Pete

Wednesday, January 7, 2015

Gold Inverse Head and Shoulder Awaiting Breakout

Click on Chart to Enlarge

Based upon the current action in gold and gold stocks it appears likely that gold will continue to form a major rally.  The daily chart pattern has the appearance of an inverse head and shoulders that has yet to break the neck line.  From a time cycle and chart structure standpoint, it appears to me that the breakout is close at hand.

I do have a bias here in that I have call options on silver as previously stated on the blog here.  My expectation is that metals will continue higher for the rest of this month.  I feel that there was and is still a quality chance for an excess of 100% return on call options prior to expiration.  But for some added time for things to unfold, I think a March or April call option would be sensible as well.

A break in the metals above the December highs could be a technical chart point of recognition resulting in either a failed breakout, or in my expectation, a continuation of the uptrend.

Pete

Today's Stock Market Rebound - What to Expect

Today the US stocks rebounded with a gap up and some further gains.  Given the larger obvious moving average uptrend and bull market, but the recent short term sell off, the question is what to expect going forward.

My feeling from the recent rally into the Christmas holiday was that the nature of the rally was a short-covering burst.  Now the gap fill and closure adds weight in my mind to that.  The issue is if the only buying power is short covering, then when the covering runs out, the market will be met with significant downside.

The recent attempted breakout above the December 5 high concurrent with classic technical bearish divergence is a sign that smart money is attempting to cap the rally at that valuation level by unloading positions on the breakout.

The rebound today occurred on significantly lower volume than yesterday, and given the intermediate term technical position coming off the bearish divergence, it looks initially here like this will be short lived and lead to further selling in stocks.  For the shorter term trader or option buyer, I think another successively lower volume advance after today would be a quality set-up for shorting or buying a speculative put option.

Without giving specific trade ideas here, I would think that a typical failed rally attempt last from 2-7 trading days, and often the resumption of a correction is rather swift, so I think that weekly options or January 30 expiration puts could be considered for ATM or slightly ITM puts and may have significant reward to risk potential.

I will try to update as frequently as necessary here to keep you ahead of the major swings if this decline continues.

Pete

Tuesday, January 6, 2015

Stock Market and Index Option Update

If you are holding or purchased any put options on the US stock indexes at my recent post about the sell warning, then the corresponding options I noted or something similar would be up over 100% currently.

At this time, the question may be whether to hold any portion of the position.

There is currently no bullish divergence pattern on the hourly MACD of SPY, and neither is there a bullish pattern as of yet on my personal trading algorithms which I use to identify bottom reversals in the markets.

So at this time it may be sensible to continue to hold part or all of a put option on the indexes.

If there are any questions or scenarios regarding this then comment or email reply and I will try to assist you.

Pete

Saturday, January 3, 2015

Time to Buy Oil or Speculate on Call Options

Click on Chart to Enlarge

The chart above is USO which is an ETF that tracks crude oil prices.  Obviously anybody at this point is aware that oil has fallen substantially.  That fact in and of itself is reason to consider buying oil or putting it on a speculative watchlist.

And when I say that "anybody" is aware of crude's decline at this point, I can say from experience in recent years of market cycles, that there are certain social "tells" that are pretty raw psychological indication that a trend is near its end.  Dependent upon your social circles, and how much you much interact with "the public" etc, you may be able to get significant information from just making note of ANY comment on a particular market by "the public".  Recently, within the last 3 weeks, I have heard people comment how low gas prices are - people that I have never heard mention prices of anything in any other conversation.  Market prices are not even on their radar. 

So if you think about the herd psychology and obviousness of the trend which must be occurring for their brain to now verbally note this in a group of others, where the potential for criticism or confrontation of significance exists, it seems to me that this is a very REAL and astute indication of the end of a trend, when the "dumb money" is compelled to note it.

So this is the current backdrop in which we find oil/energy prices.

Now we currently have other technical indications that the trend is ending. 

There is triple time frame stochastics bullish divergence (weekly, daily, hourly) at the current low.

There is daily time frame MACD divergence at the current low.

The recent consolidation on the last couple weeks formed a triangle, which typically is a pentultimate price pattern, meaning it occurs just prior to the last move of a trend.

There is now substantial Money Flow Index bullish divergence (which takes volume into consideration) and the trend in money flow appears to be turning up.

So moving to the chart above, there has been a moving average crossover of the money flow index after an extreme oversold reading with bullish divergence.

AT A BARE MINIMUM if you are short oil or energy at this point, I suggest you cover the position.

If you are an options speculator, I would suggest $19 or $20 strike calls with a few months until expiration.  A very simple, and in my estimation a well in excess of 50% probability of winning trade, would be to buy an April 20 strike call on USO and to put in a limit order to sell it at 100% gain.  Let it expire worthless if the order is not filled, or exit at expiration with the value in the option if the 100% gain is not hit in the meantime.

Another similar play would be to buy the October 20 strike call and to hold for a 100% gain with the same exit contingencies just noted in the previous idea.

If you make a trade on this and want follow up analysis or help with fine tuning the exit, then comment here or email reply to me and I will follow up on this with you.

Pete